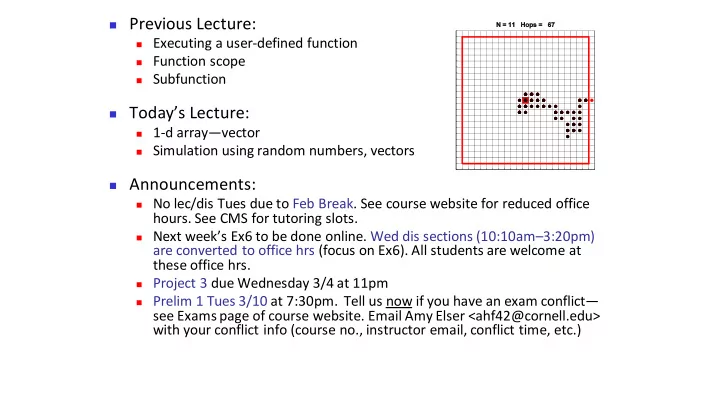

◼ Previous Lecture: ◼ Executing a user-defined function ◼ Function scope ◼ Subfunction ◼ Today’s Lecture: ◼ 1-d array — vector ◼ Simulation using random numbers, vectors ◼ Announcements: ◼ No lec/dis Tues due to Feb Break. See course website for reduced office hours. See CMS for tutoring slots. ◼ Next week’s Ex6 to be done online. Wed dis sections (10:10am – 3:20pm) are converted to office hrs (focus on Ex6). All students are welcome at these office hrs. ◼ Project 3 due Wednesday 3/4 at 11pm ◼ Prelim 1 Tues 3/10 at 7:30pm. Tell us now if you have an exam conflict — see Exams page of course website. Email Amy Elser <ahf42@cornell.edu> with your conflict info (course no., instructor email, conflict time, etc.)
Execute the statement function w = foo(v) y= foo(x) w= v + rand(); File foo.m ◼ Matlab looks for function foo (m-file called foo.m) ◼ Argument (value of x) is copied into function foo ’s local parameter ◼ Local parameter ( v ) lives in function’s own workspace ◼ called “pass -by- value,” one of several argument passing schemes used by programming languages ◼ Function code executes within its own workspace ◼ At the end, the function’s output argument (value of w ) is sent from the function to the place that calls the function. E.g., the value is assigned to y. ◼ Function’s workspace is deleted ◼ If foo is called again, it starts with a new, empty workspace
Analogy: stack of scratch paper ◼ All of your work is done on one sheet of scratch paper ◼ To call a function, first evaluate the arguments you will pass to it, based on the contents of your paper ◼ Copy those argument values to the next sheet of paper in the stack, labeled with parameter names ◼ Pass the stack to a friend (keeping your original sheet) ◼ Friend evaluates function, circles final answer, crosses out everything else ◼ You copy final answer to your sheet, then continue working
Trace 2: What is the output? y= 3; function y = f(x,y) x= 1; x= y + 1; y= x + 1; x= f(y,x); y= x; disp(y) A: 3 B: 4 C: 5 D: 6 E: 7 Function f memory space Script’s memory space
Functions and expressions ◼ Expressions may be passed as y= max( 2*x – 1, 0 ) ; function arguments ◼ Returned values may be used in fprintf('%f\n', ... expressions 100* abs( d ) /y) ◼ Combine for effect c= max(min( x^2.4, 255 ) , 0 ) ; User-defined functions work just like built-in functions
Do these do the same thing? meas= randDouble (6, 6+3) + … sLo= 6; sHi= sLo + 3; randDouble(1-2, 1); samp= randDouble(sLo, sHi); nHi= 1; nLo= nHi - 2; noise= randDouble(nLo, nHi); meas= samp + noise; A: No – one has an error B: No – they compute meas differently C: Yes, but one pattern is better in every way D: Yes, and neither is superior in all cases
New topic: Vectors
Simple data: 1-dimensional arrays [162 150 164 177 163 184] Outcomes from 1000 rolls of 1 fair dice 200 Rocket Height vs Time 180 4 x 10 18 160 b=60 140 16 b=80 120 b=90 Count 14 100 b=100 80 12 Height (feet) 60 10 40 20 8 0 1 2 3 4 5 6 6 Outcome 4 2 0 -2 0 50 100 150 200 250 300 Time (seconds)
Drawing a single line segment x1= 0; % x-coord of pt 1 y1= 1; % y-coord of pt 1 x2= 5; % x-coord of pt 2 y2= 3; % y-coord of pt 2 plot([x1 x2], [y1 y2], '-*') Line/marker format y-values x-values (a vector) (a vector)
Making an x-y plot xs= [0 4 3 8]; % x-coords ys= [1 2 5 3]; % y-coords plot(xs, ys, '-*') Line/marker format x-values y-values (a vector) (a vector) 6 5 4 3 2 1 0 0 2 4 6 8 10
1-d array: vector ◼ An array is a collection of like data organized into rows and columns ◼ A 1-d array is a row or a column, called a vector ◼ An index identifies the position of a value in a vector 0.8 0.2 v 1 1 2 3
Here are a few different ways to create a vector count= zeros(1,6) count 0 0 0 0 0 0 Similar functions: ones() , rand() a 12 15 18 21 24 a= linspace(12,24,5) b= 7:-2:0 b 7 5 3 1 c= [3 7 2 1] c 3 7 2 1 d= [3; 7; 2] d 3 7 e= d' e 3 7 2 2
Array index starts at 1 x 5 .4 .91 -4 -1 7 1 2 3 4 5 6 Let k be the index of vector x, then ◼ k must be a positive integer ◼ 1 <= k && k <= length(x) ◼ To access the k th element: x(k)
Accessing values in a vector 99 80 85 score 93 92 87 0 90 82 1 2 3 4 5 6 Given the vector score … score(4)= 80; score(5)= (score(4)+score(5))/2; k= 1; score(k+1)= 99; See plotComparison2.m
Centralize a polygon Move a polygon so that the centroid of its vertices is at the origin Before Store coordinates of the vertices in vectors x and y x y After
x= [0 2 4]; (2,3) y= [0 3 0]; 𝑦 𝑙 = 0 + 2 + 4 = 6 𝑙 𝑧 𝑙 = 0 + 3 + 0 = 3 (2,1) 𝑙 (0,0) (4,0)
function [xNew,yNew] = Centralize(x,y) % Translate polygon defined by vectors % x,y such that the centroid is on the % origin. New polygon defined by vectors % xNew,yNew. sum returns the sum of all values in the vector n= length(x); xNew= zeros(n,1); yNew= zeros(n,1); xBar= sum(x)/n; yBar= sum(y)/n; for k = 1:n x y 1 xNew(k)= x(k) - xBar; 2 yNew(k)= y(k) - yBar; ⁞ k end ⁞ n
Recommend
More recommend