CS 241 Data Organization Using GDB March 22, 2018 What is GDB? - PowerPoint PPT Presentation
CS 241 Data Organization Using GDB March 22, 2018 What is GDB? The GNU debugger Allows you to inspect the program during execution Works for several languages, including C and C++ Compiling for Debugging When you are going to use
CS 241 Data Organization Using GDB March 22, 2018
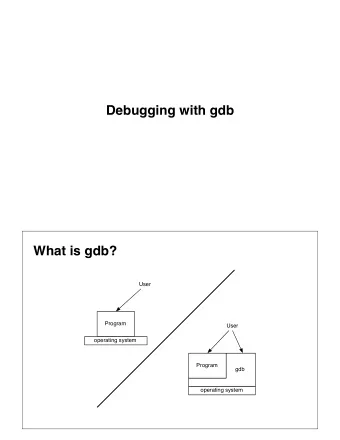
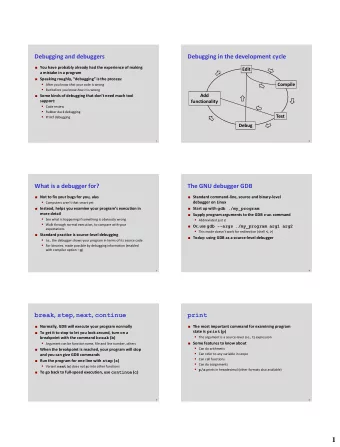
What is GDB? • The GNU debugger • Allows you to inspect the program during execution • Works for several languages, including C and C++
Compiling for Debugging When you are going to use the debugger, compile your code with the -g option to include debugging information in your executable. gcc -g -o myprog myprog.c Compiling with picky flags would look like: gcc -Wall -ansi -pedantic -g -o myprog myprog.c Makefiles will help save you typing.
Starting gdb • Generally, you’ll start gdb specifying the program to debug. > gdb myprog (gdb) • Alternatively, you can specify the program after starting the debugger. > gdb (gdb) file myprog • Use the quit command to exit.
Getting help with gdb commands • gdb is an interactive shell, similar to the shell you use in a linux terminal. • Recall history with arrow keys • Auto-complete with TAB • Give short versions of commands • If you need more information while using the debugger, use the help command. • For information on a particular command, use help commandname
Running the program • Run the program with the run command. • You can give command line arguments to the program here. • If program is runs normally outside of debugger, it should run fine here, too. • If program crashes, you’ll get useful information about where it crashed.
Segfault example 1 #include <stdio.h> 2 int main () 3 4 { 5 char *str = "value"; int i; 6 7 8 str [3] = ’x’; 9 10 for(i = 0; i < 5; i++) 11 { printf("%c\n", str[i]); 12 13 } 14 return 0; } 15 Program received signal SIGSEGV, Segmentation fault. 0x000000000040050c in main () at str-broken.c:8 8 str[3] = ’x’;
Breakpoints • You can set a breakpoint at a given line or function with the break command. • break 21 • break myfile.c:32 • break myfunction • You can set as many breakpoints as you want. • If the program reaches a breakpoint while running, it will pause and prompt you for another command.
Reached a breakpoint, now what? • Resume until next breakpoint with continue • Use step to execute the next line of code, possibly entering another function. • Use next to execute the next line of code, treating function call as single line.
Inspecting data • The print command prints the value of an expression. • Use to inspect value of variables. • Can dereference pointers, access array elements, etc.
Where am I? • Use list to display source code around the currently suspended line. • Use backtrace to show the current stack.
Watchpoints • Watchpoints pause the program whenever a watched variable’s value is modified. • Use watch myvar to start watching a myvar • Whenever myvar ’s value changes, the program will pause and print out the old and new values.
Conditional breakpoints • Perhaps you know the problem only happens under a certain condition. • You can create a conditional breakpoint that will only trigger a condition is true. • (gdb) break 6 if i == 10 will pause on line 6 only if the value of the variable i is equal to 10.
Wrong result example #include <stdio.h> 1 2 3 int factorial(int n) 4 { 5 int result = 1; 6 while(n--) 7 { 8 result *= n; 9 } 10 return result; 11 } 12 13 int main () 14 { 15 int n = 5; 16 int fact = factorial (5); 17 printf("%d! = %d\n", n, fact ); 18 return 0; 19 }
Recursive example #include <stdio.h> 1 2 3 int fib(int n) 4 { 5 if(n < 2) return 1; 6 else return fib(n-1) + fib(n -2); 7 } 8 9 int main () 10 { 11 int n = 5; 12 printf("fib(%d) = %d\n", n, fib(n)); 13 return 0; 14 }
Recommend
More recommend
Explore More Topics
Stay informed with curated content and fresh updates.
