CSE 351 Section 2 C Debugging with GDB http://goo.gl/3dHdz Lab 1 - PowerPoint PPT Presentation
CSE 351 Section 2 C Debugging with GDB http://goo.gl/3dHdz Lab 1 Lab 1 Tips Do a smaller version (i.e. 8-bit) on paper If you shift by more than the word size, behavior is undefined 0x01<<32 will not always be 0x00
CSE 351 Section 2 C Debugging with GDB http://goo.gl/3dHdz
Lab 1
Lab 1 Tips ● Do a smaller version (i.e. 8-bit) on paper ● If you shift by more than the word size, behavior is undefined ○ 0x01<<32 will not always be 0x00 ● Think about how you can use bitwise operations to create numbers ● Disregard operator restrictions at first, just get it working ● Don't do it all in one line; use intermediate steps and printf() statements ● If you get stuck, move on
Lab 1 Questions? ● Office hours today in CSE002 ● Read the discussion board ● Email Gaetano or the TAs ● Can answer clarification questions now
Debugging with GDB
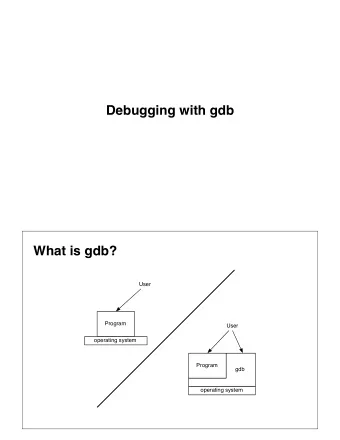
What is GDB? ● GNU Project Debugger ● Offers four basic functionalities ○ Runs your program ○ Allows you to set breakpoints to stop execution ○ Allows you to inspect the state of your program once execution is stopped ○ Lets you fix bugs within GDB ● The sooner you get comfortable with GDB, the easier this class will be
C-level Debugging ● GDB has many advanced features ● Today we will cover the top level of GDB ○ Running your program ○ Stepping through C code ○ Setting breakpoints in C code ○ Examining variable values ○ Examining locations in memory
Compile Program for GDB ● When compiling with gcc, use the -g flag gcc -g <source.c> -o <name>
Running GDB ● To start up GDB, simply run gdb <executable> ● Once GDB has started up, type run to execute your program from within GDB ● To exit GDB, type quit
Setting Breakpoints ● If you just run your program, it keeps going until completion without stopping. ● Breakpoints allow us to pause at various parts of our program. ● Stop when we reach a certain function: break <function-name> ● Stop when we reach an instruction address: break <address>
Stepping Through C ● When our program is paused, we need to step to the next instruction: ● Execute one or several C statements step or step <# to skip> ● Execute one assembly command stepi or stepi <# to skip>
Examining Program State Two main ways to look at variables: ● By value (print): print <var-name> Also: print /x, print /d, print /t ● By address (x): x <address> ex: x 0xFFABCDEF Also: x /x, x /d
Example debugging run Sample file: http://goo.gl/tfT5a wget http://www.cs.washington.edu/education/courses/cse351/12au/section-slides/gdb_example.c To compile: gcc -g gdb_example.c -o gdb_ex Debugging commands: http://goo.gl/LcQfF
GDB Cheatsheet(s) Should be very useful for the next lab http://csapp.cs.cmu.edu/public/docs/gdbnotes-x86-64. pdf (may add more later)
Recommend
More recommend
Explore More Topics
Stay informed with curated content and fresh updates.
