Lab 6: Debuggers GDB Breakpoints Inspection TUI mode - PowerPoint PPT Presentation
Debuggers Lab 6: Debuggers GDB Breakpoints Inspection TUI mode Code::Blocks plugin KDevelop and KDbg Miscellaneous Comp Sci 1585 Data Structures Lab: Tools for Computer Scientists Outline Debuggers GDB Breakpoints Inspection TUI
Debuggers Lab 6: Debuggers GDB Breakpoints Inspection TUI mode Code::Blocks plugin KDevelop and KDbg Miscellaneous Comp Sci 1585 Data Structures Lab: Tools for Computer Scientists
Outline Debuggers GDB Breakpoints Inspection TUI mode Code::Blocks plugin 1 Debuggers KDevelop and KDbg Miscellaneous 2 GDB Breakpoints Inspection TUI mode Code::Blocks plugin KDevelop and KDbg Miscellaneous
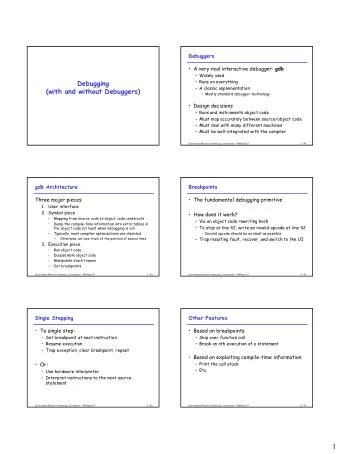
Debuggers Debuggers GDB Breakpoints Inspection TUI mode Code::Blocks plugin • Step through code one line at a time KDevelop and KDbg Miscellaneous • Inspect variables, including structs and classes • View disassembly • Check the call stack • $ gdb Command-line debugger • $ kdbg GUI frontend for gdb
Outline Debuggers GDB Breakpoints Inspection TUI mode Code::Blocks plugin 1 Debuggers KDevelop and KDbg Miscellaneous 2 GDB Breakpoints Inspection TUI mode Code::Blocks plugin KDevelop and KDbg Miscellaneous
Using $ gdb Debuggers GDB Breakpoints Inspection TUI mode Code::Blocks plugin KDevelop and KDbg • $ gdb your-program launches the debugger Miscellaneous • Note: You will want to compile with $ g++ -g • (gdb) run arg1 arg2 ... runs the command with command line arguments • (gdb) backtrace or (gdb) bt shows the call stack
Outline Debuggers GDB Breakpoints Inspection TUI mode Code::Blocks plugin 1 Debuggers KDevelop and KDbg Miscellaneous 2 GDB Breakpoints Inspection TUI mode Code::Blocks plugin KDevelop and KDbg Miscellaneous
Setting breakpoints with $ gdb Debuggers GDB Breakpoints Inspection TUI mode • (gdb) break filename.cpp:10 will stop execution Code::Blocks plugin whenever line 10 in ‘filename.cpp’ is reached. KDevelop and KDbg Miscellaneous • (gdb) continue resumes running as normal. • (gdb) step runs one more line of code. • (gdb) next runs until execution is on the next line. • (gdb) finish runs until the current function returns. • (gdb) delete removes all breakpoints. • More on breakpoints
Outline Debuggers GDB Breakpoints Inspection TUI mode Code::Blocks plugin 1 Debuggers KDevelop and KDbg Miscellaneous 2 GDB Breakpoints Inspection TUI mode Code::Blocks plugin KDevelop and KDbg Miscellaneous
Looking at variables with $ gdb Debuggers GDB Breakpoints Inspection • (gdb) p variable prints the contents of ‘variable’. TUI mode Code::Blocks plugin KDevelop and • (gdb) p also works with expressions of just about any KDbg Miscellaneous sort. • (gdb) x address examines one word memory at a given address. • (gdb) x/2 address examines two words of memory. • More on examining memory • (gdb) info registers lists all register values. • (gdb) p $regname prints the value of a register.
Outline Debuggers GDB Breakpoints Inspection TUI mode Code::Blocks plugin 1 Debuggers KDevelop and KDbg Miscellaneous 2 GDB Breakpoints Inspection TUI mode Code::Blocks plugin KDevelop and KDbg Miscellaneous
Text User Interface (TUI) mode Debuggers GDB Breakpoints Inspection TUI mode Code::Blocks plugin • $ gdb a.out -tui KDevelop and KDbg Miscellaneous or • (gdb) tui enable • (gdb) help layout • (gdb) layout Most useful: (gdb) start followed by (gdb) layout src
Outline Debuggers GDB Breakpoints Inspection TUI mode Code::Blocks plugin 1 Debuggers KDevelop and KDbg Miscellaneous 2 GDB Breakpoints Inspection TUI mode Code::Blocks plugin KDevelop and KDbg Miscellaneous
Code::Blocks plugin Debuggers GDB Breakpoints Inspection TUI mode Code::Blocks plugin KDevelop and KDbg Miscellaneous 1 make a project, accepting defaults for debug target 2 add your files 3 use the debug menu to run/start/step 4 right click on variables to watch them
Outline Debuggers GDB Breakpoints Inspection TUI mode Code::Blocks plugin 1 Debuggers KDevelop and KDbg Miscellaneous 2 GDB Breakpoints Inspection TUI mode Code::Blocks plugin KDevelop and KDbg Miscellaneous
KDevelop and KDbg Debuggers GDB Breakpoints Inspection TUI mode Code::Blocks plugin KDevelop and KDbg Miscellaneous Both good options for another graphical interface
Outline Debuggers GDB Breakpoints Inspection TUI mode Code::Blocks plugin 1 Debuggers KDevelop and KDbg Miscellaneous 2 GDB Breakpoints Inspection TUI mode Code::Blocks plugin KDevelop and KDbg Miscellaneous
Miscellaneous Debuggers GDB Breakpoints Inspection TUI mode Conditional Breakpoints: Code::Blocks plugin (gdb) condition breakpoint number expression KDevelop and KDbg Miscellaneous Editing variables with $ gdb : • (gdb) set var VARIABLE NAME = value assigns ‘value’ to ‘VARIABLE NAME’ • (gdb) set { int } 0x1234 = 4 writes 4 as an integer to the memory address 0x1234 Disassembling code: (gdb) disassemble function prints the assembly for a function.
Recommend
More recommend
Explore More Topics
Stay informed with curated content and fresh updates.
