Debugging Techniques for C Programs Debugging Basics Will focus - PDF document
Debugging Techniques for C Programs Debugging Basics Will focus on the gcc/gdb combination. Will also talk about the ddd gui for gdb (lots of value added to gdb). First, debugging in the abstract: Program state is a snapshot
Debugging Techniques for C Programs
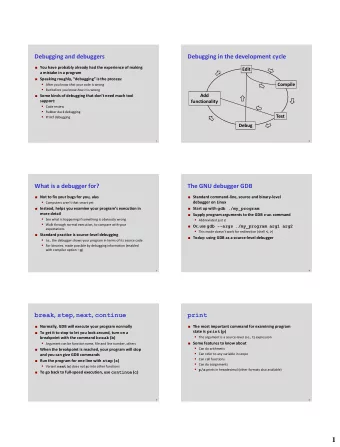
Debugging Basics • Will focus on the gcc/gdb combination. • Will also talk about the ddd gui for gdb (lots of value added to gdb). • First, debugging in the abstract: – Program state is a snapshot of all variables, PC, etc. – A statement in your program transforms one program state into another. – You should be able (at some level) to express what you expect the state of your program to be after every statement. – Often state predicates on program state; i.e., “if control is here, I expect the following to be true.” • Map into a toy example. CS3411 Debugging 2
Small Example: ave .c # inc lude <s td i o .h> sum should be 0 and num should be 0. i n tsum=0 , va l , n um=0 ; doub le ave ; main ( ) sum should be the total of { the num input values processed. wh i l e ( s can f ( "%d \n " ,&val ) ! = EOF) { sum += va l ; sum should be the total of num++ ; the num input values and } there is no more input. i f ( num > 0 ) { ave should be the floating ave = sum/num; point mean of the num input data values. p r i n t f ( "Ave ragei s % f \ n" , ave ) ; } } CS3411 Debugging 3
Small Example: ave .c % a .ou t 1 Average i s 1 .000000 % a .ou t 1 2 3 Average i s 2 .000000 % a .ou t 1 2 3 4 Average i s 2 .000000 Experienced programmer can probably “eyeball debug” the program from this output CS3411 Debugging 4
Using gdb Make sure to compile source with the -g switch asserted. • In our case, gcc -g ave .c • • Breakpoint : line in source code at which debugger will pause execution. At breakpoint, can examine values of relevant components of program state. br eak command sets a breakpoint; c l ea r removes the breakpoint. • Diagnostic pr i n t f ( ) crude, but effective way of getting a snapshot of program state at a given point. Once paused at a breakpoint, use gdb pr i n t , or d ispl a y to show • variable or expression values. d i sp lay will automatically print values when execution halts at breakpoint. From a breakpoint, may st ep or nex t to single step the program. • s tep stops after next source line is executed. nex t similar, but executes functions without stopping. CS3411 Debugging 5
Using gdb • May find out where execution is, in terms of function call chain, with the where command; also shows function argument values. • Apply some of this in context of bogus averaging program. • To make things easier, put the problematic data set in a file named data. % a .ou t < da ta Average i s 2 .000000 CS3411 Debugging 6
Using gdb ( ave .c ) % gdb a. ou t GNU gdb 6 .1 Copy r i g h t 2004 Free So f twa re Founda t i o n , I nc . GDB i s f r ee so f t ware , cove red by t he GNU Gene r a l Pub l i c L i cense , and you a re we l come to change i t and /o r d i s t r i bu t e cop ies of i t under ce r t a i n cond i t i o ns . Type " s how copy ing " t o see t he cond i t i o ns . There i s abso lu t e l y no wa r ran t y f o r GDB. Type " show wa r ran t y ” f o r de ta i l s . Th i s GDB was con f i gu red as " i 5 86 -suse- l i nux " . . . Us ing hos t l i b t h read_dbl i b rar y " / l i b / t l s / l i b t h read_db .so .1 " . ( gdb ) CS3411 Debugging 7
Using gdb ( ave .c ) ( gdb ) l 1 # i ncl ude <s td i o .h> 2 3 i n ts um=0 , va l , num=0 ; 4 doub le ave ; 5 Interesting point: top of main loop. 6 ma i n ( ) 7 { 8 whi l e ( scan f ( "%d \n " ,&va l ) ! = EOF) { 9 s um += va l ; 10 num++ ; ( gdb ) l Another interesting point: just 11 } before ave is computed. 12 i f ( num > 0 ) { 13 ave = sum/num; 14 p r i n t f ( "Ave ragei s %f \n " , ave ) ; 15 } 16 } 17 ( gdb ) CS3411 Debugging 8
Using gdb ( ave .c ) ( gdb ) b reak 8 Breakpo i n t 1 a t 0x80483dc : f i l e ave . c , l i ne 8 . ( gdb ) b reak 13 Breakpo i n t 2 a t 0x8048414 : f i l e ave . c , l i ne 13 . ( gdb ) d i s p lay num ( gdb ) d i s p lay va l ( gdb ) d i s p lay sum ( gdb ) r < da ta Sta r t i ng pr og ram: / home/ jmayo /cou rses .d … Breakpo i n t 1 , ma in ( ) a t ave . c :8 8 whi l e ( scan f ( "%d \n " ,&va l ) ! = EOF) { 3 : sum = 0 2 : va l = 0 1 : num = 0 ( gdb ) c Con t i nu ing . Breakpo i n t 1 , ma in ( ) a t ave . c :8 8 whi l e ( scan f ( "%d \n " ,&va l ) ! = EOF) { 3 : sum = 1 2 : va l = 1 1 : num = 1 CS3411 Debugging 9
Using gdb ( ave .c ) ( gdb ) c Con t i nu i ng . Breakpoi n t 1 , ma in ( ) a t ave .c :8 8 wh i l e ( scan f ( "%d \n" ,&va l ) ! = EOF) { 3 : sum = 3 2 : va l = 2 1 : num = 2 ( gdb ) c Con t i nu i ng . Breakpoi n t 1 , ma in ( ) a t ave .c :8 8 wh i l e ( scan f ( "%d \n" ,&va l ) ! = EOF) { 3 : sum = 6 2 : va l = 3 1 : num = 3 CS3411 Debugging 10
Using gdb ( ave .c ) ( gdb ) c Con t i nu i ng . Breakpoi n t 1 , ma in ( ) a t ave .c :8 8 wh i l e ( scan f ( "%d \n" ,&va l ) ! = EOF) { 3 : sum = 10 2 : va l = 4 1 : num = 4 ( gdb ) c Con t i nu i ng . Breakpoi n t 2 , ma in ( ) a t ave .c :13 13 ave = s um/num; 3 : sum = 10 2 : va l = 4 1 : num = 4 CS3411 Debugging 11
Using gdb ( ave .c ) ( gdb ) n 14 p r i n t f ( " Ave rage i s % f \n " , ave ) ; 3 : sum = 10 Everything fine until ave is 2 : va l = 4 computed. Integer division the 1 : num = 4 problem. ( gdb ) p ave $1 = 2 Evaluate expression inside ( gdb ) p ( doub le ) s um/ (doub le )num $2 = 2 .5 gdb to validate our reasoning. ( gdb ) c Con t i nu i ng . Average i s 2 .000000 Prog ram ex i t ed wi th code 024 . ( gdb ) q % CS3411 Debugging 12
A GUI for gdb : ddd The ddd program is just a GUI front-end for gdb . • • Value added three main ways: – Can mouse left on source line, then mouse left on Break a t ( ) to set a breakpoint. Or mouse right on a source line and set a breakpoint in the menu that pops up. – Can mouse left on variable, then mouse left on Pr in t ( ) or Disp lay ( ) to examine data values. Or get value displayed at bottom of ddd window by ``mouse hovering'' over a variable name. – Displayed values graphically displayed. Click on a pointer value, graphically display thing pointed to. Visualize complex linked data structures. • Play with inorder tree traversal program. CS3411 Debugging 13
Using ddd (inorder.c) Introduce a pointer-related bug into the program by modifying the inorder() function: . . . . . vo id i no r de r ( r ) Formerly: s t ruc t n ode * r ; i f ( r ! = NI LNODE) { { i no rde r ( r -> l e f t ) ; i no rde r ( r -> l e f t ) ; p r i n t f ( "%c" , r ->da ta ) ; p r i n t f ( "%c" , r ->da ta ) ; i no rde r ( r -> r i g h t ) ; i no rde r ( r -> r i g h t ) ; } } CS3411 Debugging 14
Quickie Post Mortem Debugging ( c ) i norder . % a .ou t Segment a t i on f a u l t ( co re dumped ) % gdb a. ou t co r e GNU gdb 6 .1 . . . . . . . . . . Core was gene r a ted by ` . / a .ou t co re ' . Prog ram t e rm inat ed w i t h s igna l 1 1 , Segmen ta t i on f au l t . . . . . . . . . . . Read ing s ymbo l s f r om / l i b / t l s / l i b c . so .6 . . . d one . Loaded symbo l s f o r / l i b / t l s / l i bc . so. 6 Function in which segfaulted. Read ing s ymbo l s f r om / l i b / l d - l i nux . so .2 . . . done . Arguments to function. Loaded symbo l s f o r / l i b / l d - l i nux . s o .2 #0 0x080484d5 i n i no rder( r=0x0 ) a t buggy_ ino rder . c : 38 38 i no rde r ( r -> l e f t ) ; Line of source where segfaulted. ( gdb ) CS3411 Debugging 15
Quickie Post Mortem Debugging ( c ) i norder . ( gdb ) whe re #0 0x080484d5 i n i no rder( r=0x0 ) a t buggy_ ino rder . c : 38 #1 0x080484dd i n i no rder( r=0x804a008 ) a t buggy_ ino rder . c : 38 #2 0x080484dd i n i no rder( r=0x804a028 ) a t buggy_ ino rder . c : 38 #3 0x080484dd i n i no rder( r=0x804a048 ) a t buggy_ ino rder . c : 38 #4 0x080484dd i n i no rder( r=0x804a068 ) a t buggy_ ino rder . c : 38 #5 0x08048479 i n ma in ( ) a t buggy_ ino rde r . c :21 The above listing walks back the call chain as it was at the moment of the segfault. Clear that we dereferenced a null pointer in a call to i no rder ( ) at a leaf node of the binary tree. CS3411 Debugging 16
17 Debugging CS3411
Recommend
More recommend
Explore More Topics
Stay informed with curated content and fresh updates.
