Debugging programs on Linux: An Overview of gdb, idb, Insure++, - PowerPoint PPT Presentation
Debugging programs on Linux: An Overview of gdb, idb, Insure++, Valgrind, ccmalloc and mpatrol Jarno Laitinen (Jarno.Laitinen@cern.ch) Slides: http://www.lut.fi/u/jtl7950/dbg_slides.pdf 1 Debugging Problems occurs - especially with C/C++
Debugging programs on Linux: An Overview of gdb, idb, Insure++, Valgrind, ccmalloc and mpatrol Jarno Laitinen (Jarno.Laitinen@cern.ch) Slides: http://www.lut.fi/u/jtl7950/dbg_slides.pdf
1 Debugging • Problems occurs - especially with C/C++ pointers and memory handling (new, malloc/calloc, free, delete) • Segmentation fault: exceeding memory area • But where and when?!
2 Printf as debugging method • Simple, no need for tools • Needs recompiling, inserting lines (where?!) and removing them (in good case) • Too much stdout is problematic (especially in loops etc.) to follow and slows execution • Maybe problematic in multithread or process case (logfiles?) • Often useful to print source code file and line number printf("Thread.c: %d: numThreads: %d\n",__LINE__,numThreads);
3 Compiler options to enable debugging • Usually recommended to reduce optimisation (to -O1 or -O0 ) • Option -g is needed to show source code by many debuggers (some might not want it) • gcc: For gdb exists also -ggdb • gcc: For -g and -ggdb can be set levels 1-3. e.g. ”Some debuggers support macro expansion when you use -g3” • Warnings may help to spot the problem. It seems that icc produces more warnings by default than gcc. • More gcc warning with -Wall . Also several others e.g. -Wfloat-equal Reporter.c:723: warning: comparing floating point with == or != is unsafe
4 Common functionality of debuggers • Run & kill, break & continue the execution • Breakpoints: to stop on certain line/function (may have condtion) • Watchpoints: stop if certain variable read or written (variables can be seen on local stack) • clear & delete, disable & enable temporarily • Step (to next line) or next (through subroutine) to line (#lines can be given as a parameter) • Show backtrace of calls when crashed • Print value or type of an variable or structure • Some may allow setting value and executing printf
5 • Some may support (more or less better) POSIX threads (in gdb info threads, thread th number • Also running processes may be attached ( attach process id and detach in gdb) • Special action need to debug child processes tutorial • info (in gdb) about processes, threads, breakpoints.. • OpenMP (threads) and message passing libraries (MPI, PVM) exists specific debuggers
6 Usage of idb • Documentation on Intel’s web site • A bit different than gdb, can be set to -gdb mode (other mode dbx (Berkeley UNIX symbolic debugger)). • Include source code files with -I directory • GUI ( -gui ) is worth of trying! ddd can use idb too. • Exists at least in some oplapro (IA-64) machines • Has limitations as well e.g. does not support new and delete C++ calls
7 IDB example Thread received signal SEGV stopped at [<opaque> __cfree(...) 0x200000000038b5a0] Information: An <opaque> type was presented during execution of the previous command. For complete type information on this symbol, recompilation of the program will be necessary. Consult the compiler man pages for details on producing full symbol table information using the ’-g’ (and ’-gall’ for cxx) flags. (idb) where >0 0x200000000038b5a0 in __cfree(...) in /lib/tls/libc.so.6.1 #1 0x2000000000151480 in /usr/lib/libstdc++.so.5 #2 0x2000000000151550 in /usr/lib/libstdc++.so.5 #3 0x400000000000bc90 in Settings_Destroy(mSettings=0x6000000000012ce0) "Settings.cpp":262 #4 0x4000000000003f80 in thread_run_wrapper(paramPtr=<no value>) "Thread.c":264 #5 0x2000000000288510 in start_thread(...) in /lib/tls/libpthread.so.0
8
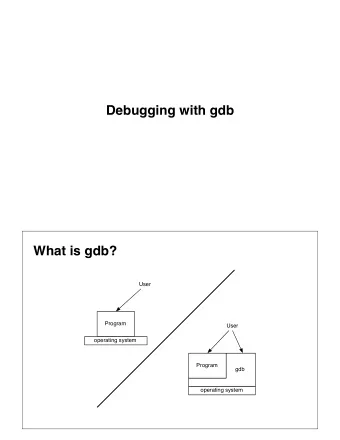
9 GNU debugger (gdb) http://www.gnu.org/software/gdb/gdb. • Homepage and docs: html • Many GUIs cgdb (ncurses), ddd (X), kdbg, (KDE, probably best of these) and insight (X) • Start debugging: gdb [--args] ./executable [arg1] • Set source file directories dir sub1 : sub2 • Starting the execution: run Stopping the execution: kill ( quit to exit gdb) • Help: help [command] • List code lines: list (params can be file, function, lines or address) • To see, where it crashed: where or backtrace , which gives list of frames
10 • To choose frame: frame nmb or up or down . Print vars info locals (gdb) up #1 0x0804b7da in Server::Run (this=0x806f220) at Server.cpp:110 110 currLen = recv( mSettings->mSock, mBuf, mSettings->mBufLen, 0 ); (gdb) info locals currLen = 8192 mBuf_UDP = (UDP_datagram *) 0x806f238 reportstruct = (ReportStruct *) 0x805b060 (gdb) list 105 if ( reportstruct != NULL ) { 106 reportstruct->packetID = 0; • Breakpoints: (temporary (deleted when hit)) tbreak and non-temporary: break . Both takes as a parameter function name or line number • Priting variable: print variable • Setting varible: set variable=3 • Possibly to monitor ( watch ) a variable (read,write,condition)
11 • Has problems with multiple threads (NPTL library) ⋆ reading register r1 (#1): No such process. or ⋆ Cannot find thread 655401: no thread to satisfy query ⋆ Probably using back port setenv LD ASSUME KERNEL 2.4.1 works better Program received signal SIGSEGV, Segmentation fault. [Switching to Thread 65541 (LWP 2447)] 0x0804fbf1 in ReportPacket (agent=0xd156728, packet=0x805bab8) at Reporter.c:321 321 int index = agent->reporterindex; Current language: auto; currently c (gdb) list ReportPacket 314 * the arrival or departure of a "packet" (for TCP it 315 * will actually represent many packets). This needs to 316 * be as simple and fast as possible as it gets called for 317 * every "packet". 318 */ 319 void ReportPacket( ReportHeader* agent, ReportStruct *packet ) { 320 if ( agent != NULL ) { 321 int index = agent->reporterindex;
12 322 /* 323 * First find the appropriate place to put the information (gdb) print index $1 = 1074857152 (gdb) whatis agent->reporterindex type = int (gdb) print agent->reporterindex Cannot access memory at address 0xd156728 (gdb) break ReportPacket Breakpoint 1 at 0x804fbe4: file Reporter.c, line 320. (gdb) run The program being debugged has been started already. Start it from the beginning? (y or n) y Breakpoint 1, ReportPacket (agent=0x8083d28, packet=0x8083d08) at Reporter.c:320 320 if ( agent != NULL ) {
13 (gdb) next 321 int index = agent->reporterindex; (gdb) print agent->reporterindex $3 = 699 (gdb) clear ReportPacket Deleted breakpoints 2 1 (gdb) continue Program received signal SIGSEGV, Segmentation fault. [Switching to Thread 65541 (LWP 2542)] 0x401d114c in memcpy () from /lib/libc.so.6 (gdb) where #0 0x401d114c in memcpy () from /lib/libc.so.6 #1 0x0804fc67 in ReportPacket (agent=0x805baf8, packet=0x805c000) at Reporter.c:341 #2 0x0804b8e7 in Server::Run() (this=0x805baf8) at Server.cpp:122 #3 0x0804a243 in server_spawn (thread=0x805c000) at Launch.cpp:85 #4 0x08049c7f in thread_run_wrapper (paramPtr=0x805c000) at Thread.c:216 #5 0x40109c40 in pthread_start_thread_event () from
14 /lib/libpthread.so.0 (gdb) list Reporter.c:341 336 thread_rest(); 337 index = agent->reporterindex; 338 } 339 340 // Put the information there 341 memcpy( agent->data + agent->agentindex, packet, sizeof(ReportStruct) ); (gdb) print agent->data No symbol "agent" in current context.
15 Figure 2: kdbg: A nice user interface for gdb
16 Figure 3: Insight: Yet another GUI for gdb. A bit nicer than ddd.
17 Post-mortem analysis of a core dump • No need to run in debugger • To get core dump when segfaulting, ulimit -c none (may be a big) (gdb) core core.23257 Core was generated by ‘./iperf -s’. Program terminated with signal 11, Segmentation fault. Reading symbols from /usr/lib/libstdc++.so.5...done. Loaded symbols for /usr/lib/libstdc++.so.5 .. (gdb) backtrace #0 0x200000000038ddd0 in _int_free () from /lib/tls/libc.so.6.1 #1 0x200000000038b620 in free () from /lib/tls/libc.so.6.1 #2 0x2000000000151480 in operator delete(void*) () from /usr/lib/libstdc++.so.5 #3 0x400000000000c070 in Settings_Destroy (mSettings=0x600000000001bc80) at Settings.cpp:266 ..
18 Valgrind • GPL licensed: http://valgrind.kde.org/ • Support NPTL threads, but not IA-64 • Takes binary file, written in any language, as a parameter • Can start debugger on errorneous point (–db-attach=yes) • Logfile: --log-file=something • Couple projects to create GUI (Gnome/Kde devel needed) • Also profiler projects (picture from kcachegrind
19 Figure 4: kcachegrind
20 • Valgrind core can be extended with plugins (–tool) ⋆ memcheck : To detect memory-management problems (C/C++) use of uninitialised mem, R/W freed memory or inappropriate places, mem- ory leaks, mismatched allocation and frees (C vs. C++), passing unini- tialised/unaddressible mem to syscalls and misuse of some POSIX theads ==9112== Thread 2: ==9112== Invalid read of size 8 ==9112== at 0x8050782: reporter_handle_multiple_reports (Reporter.c:716) ==9112== by 0x8050AAF: reporter_condprintstats (Reporter.c:781) ==9112== Thread 2: ==9112== Invalid read of size 4 ==9112== at 0x80508CF: reporter_handle_multiple_reports (Reporter.c:741) ==9112== by 0x8050AAF: reporter_condprintstats (Reporter.c:781) ==9112== by 0x805071A: reporter_handle_packet (Reporter.c:702) ==9112== by 0x80504E7: reporter_process_report (Reporter.c:630) ==9112== Address 0x1BB69FD4 is not stack’d, malloc’d or (recently) free’d
Recommend
More recommend
Explore More Topics
Stay informed with curated content and fresh updates.
