GDB Tutorial A Walkthrough with Examples CMSC 212 - Spring 2009 - PowerPoint PPT Presentation
GDB Tutorial A Walkthrough with Examples CMSC 212 - Spring 2009 Last modified March 22, 2009 GDB Tutorial What is gdb ? GNU Debugger A debugger for several languages, including C and C++ It allows you to inspect what the program is doing
GDB Tutorial A Walkthrough with Examples CMSC 212 - Spring 2009 Last modified March 22, 2009 GDB Tutorial
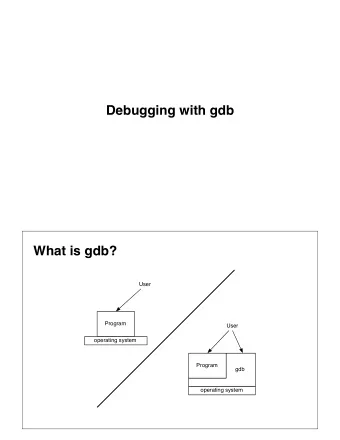
What is gdb ? “GNU Debugger” A debugger for several languages, including C and C++ It allows you to inspect what the program is doing at a certain point during execution. Errors like segmentation faults may be easier to find with the help of gdb . http://sourceware.org/gdb/current/onlinedocs/gdb toc.html - online manual GDB Tutorial
What is gdb ? “GNU Debugger” A debugger for several languages, including C and C++ It allows you to inspect what the program is doing at a certain point during execution. Errors like segmentation faults may be easier to find with the help of gdb . http://sourceware.org/gdb/current/onlinedocs/gdb toc.html - online manual GDB Tutorial
What is gdb ? “GNU Debugger” A debugger for several languages, including C and C++ It allows you to inspect what the program is doing at a certain point during execution. Errors like segmentation faults may be easier to find with the help of gdb . http://sourceware.org/gdb/current/onlinedocs/gdb toc.html - online manual GDB Tutorial
What is gdb ? “GNU Debugger” A debugger for several languages, including C and C++ It allows you to inspect what the program is doing at a certain point during execution. Errors like segmentation faults may be easier to find with the help of gdb . http://sourceware.org/gdb/current/onlinedocs/gdb toc.html - online manual GDB Tutorial
What is gdb ? “GNU Debugger” A debugger for several languages, including C and C++ It allows you to inspect what the program is doing at a certain point during execution. Errors like segmentation faults may be easier to find with the help of gdb . http://sourceware.org/gdb/current/onlinedocs/gdb toc.html - online manual GDB Tutorial
Additional step when compiling program Normally, you would compile a program like: gcc [flags] <source files> -o <output file> For example: gcc -Wall -Werror -ansi -pedantic-errors prog1.c -o prog1.x Now you add a -g option to enable built-in debugging support (which gdb needs): gcc [other flags] -g <source files> -o <output file> For example: gcc -Wall -Werror -ansi -pedantic-errors -g prog1.c -o prog1.x GDB Tutorial
Additional step when compiling program Normally, you would compile a program like: gcc [flags] <source files> -o <output file> For example: gcc -Wall -Werror -ansi -pedantic-errors prog1.c -o prog1.x Now you add a -g option to enable built-in debugging support (which gdb needs): gcc [other flags] -g <source files> -o <output file> For example: gcc -Wall -Werror -ansi -pedantic-errors -g prog1.c -o prog1.x GDB Tutorial
Starting up gdb Just try “ gdb ” or “ gdb prog1.x .” You’ll get a prompt that looks like this: (gdb) If you didn’t specify a program to debug, you’ll have to load it in now: (gdb) file prog1.x Here, prog1.x is the program you want to load, and “file” is the command to load it. GDB Tutorial
Starting up gdb Just try “ gdb ” or “ gdb prog1.x .” You’ll get a prompt that looks like this: (gdb) If you didn’t specify a program to debug, you’ll have to load it in now: (gdb) file prog1.x Here, prog1.x is the program you want to load, and “file” is the command to load it. GDB Tutorial
Before we go any further gdb has an interactive shell, much like the one you use as soon as you log into the linux grace machines. It can recall history with the arrow keys, auto-complete words (most of the time) with the TAB key, and has other nice features. Tip If you’re ever confused about a command or just want more information, use the “ help ” command, with or without an argument: (gdb) help [command] You should get a nice description and maybe some more useful tidbits. . . GDB Tutorial
Before we go any further gdb has an interactive shell, much like the one you use as soon as you log into the linux grace machines. It can recall history with the arrow keys, auto-complete words (most of the time) with the TAB key, and has other nice features. Tip If you’re ever confused about a command or just want more information, use the “ help ” command, with or without an argument: (gdb) help [command] You should get a nice description and maybe some more useful tidbits. . . GDB Tutorial
Running the program To run the program, just use: (gdb) run This runs the program. If it has no serious problems (i.e. the normal program didn’t get a segmentation fault, etc.), the program should run fine here too. If the program did have issues, then you (should) get some useful information like the line number where it crashed, and parameters to the function that caused the error: Program received signal SIGSEGV, Segmentation fault. 0x0000000000400524 in sum array region (arr=0x7fffc902a270, r1=2, c1=5, r2=4, c2=6) at sum-array-region2.c:12 GDB Tutorial
Running the program To run the program, just use: (gdb) run This runs the program. If it has no serious problems (i.e. the normal program didn’t get a segmentation fault, etc.), the program should run fine here too. If the program did have issues, then you (should) get some useful information like the line number where it crashed, and parameters to the function that caused the error: Program received signal SIGSEGV, Segmentation fault. 0x0000000000400524 in sum array region (arr=0x7fffc902a270, r1=2, c1=5, r2=4, c2=6) at sum-array-region2.c:12 GDB Tutorial
Running the program To run the program, just use: (gdb) run This runs the program. If it has no serious problems (i.e. the normal program didn’t get a segmentation fault, etc.), the program should run fine here too. If the program did have issues, then you (should) get some useful information like the line number where it crashed, and parameters to the function that caused the error: Program received signal SIGSEGV, Segmentation fault. 0x0000000000400524 in sum array region (arr=0x7fffc902a270, r1=2, c1=5, r2=4, c2=6) at sum-array-region2.c:12 GDB Tutorial
So what if I have bugs? Okay, so you’ve run it successfully. But you don’t need gdb for that. What if the program isn’t working? Basic idea Chances are if this is the case, you don’t want to run the program without any stopping, breaking, etc. Otherwise, you’ll just rush past the error and never find the root of the issue. So, you’ll want to step through your code a bit at a time, until you arrive upon the error. This brings us to the next set of commands. . . GDB Tutorial
So what if I have bugs? Okay, so you’ve run it successfully. But you don’t need gdb for that. What if the program isn’t working? Basic idea Chances are if this is the case, you don’t want to run the program without any stopping, breaking, etc. Otherwise, you’ll just rush past the error and never find the root of the issue. So, you’ll want to step through your code a bit at a time, until you arrive upon the error. This brings us to the next set of commands. . . GDB Tutorial
So what if I have bugs? Okay, so you’ve run it successfully. But you don’t need gdb for that. What if the program isn’t working? Basic idea Chances are if this is the case, you don’t want to run the program without any stopping, breaking, etc. Otherwise, you’ll just rush past the error and never find the root of the issue. So, you’ll want to step through your code a bit at a time, until you arrive upon the error. This brings us to the next set of commands. . . GDB Tutorial
Setting breakpoints Breakpoints can be used to stop the program run in the middle, at a designated point. The simplest way is the command “ break .” This sets a breakpoint at a specified file-line pair: (gdb) break file1.c:6 This sets a breakpoint at line 6 , of file1.c . Now, if the program ever reaches that location when running, the program will pause and prompt you for another command. Tip You can set as many breakpoints as you want, and the program should stop execution if it reaches any of them. GDB Tutorial
More fun with breakpoints You can also tell gdb to break at a particular function. Suppose you have a function my func : int my func(int a, char *b); You can break anytime this function is called: (gdb) break my func GDB Tutorial
Now what? Once you’ve set a breakpoint, you can try using the run command again. This time, it should stop where you tell it to (unless a fatal error occurs before reaching that point). You can proceed onto the next breakpoint by typing “ continue ” (Typing run again would restart the program from the beginning, which isn’t very useful.) (gdb) continue You can single-step (execute just the next line of code) by typing “ step .” This gives you really fine-grained control over how the program proceeds. You can do this a lot ... (gdb) step GDB Tutorial
Now what? Once you’ve set a breakpoint, you can try using the run command again. This time, it should stop where you tell it to (unless a fatal error occurs before reaching that point). You can proceed onto the next breakpoint by typing “ continue ” (Typing run again would restart the program from the beginning, which isn’t very useful.) (gdb) continue You can single-step (execute just the next line of code) by typing “ step .” This gives you really fine-grained control over how the program proceeds. You can do this a lot ... (gdb) step GDB Tutorial
Recommend
More recommend
Explore More Topics
Stay informed with curated content and fresh updates.
