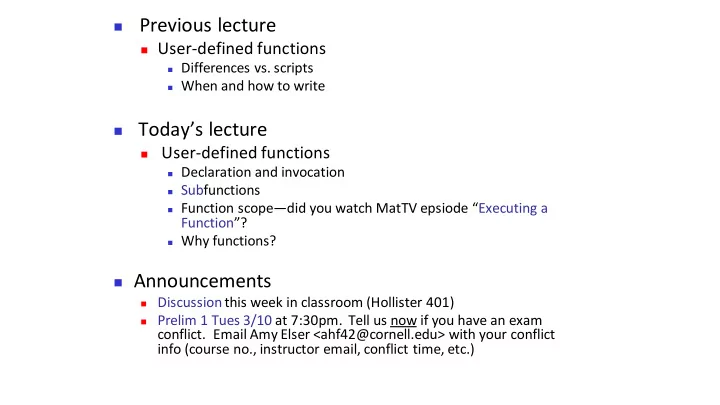
SLIDE 1 ◼ Previous lecture
◼ User-defined functions
◼ Differences vs. scripts ◼ When and how to write
◼ Today’s lecture
◼ User-defined functions
◼ Declaration and invocation ◼ Subfunctions ◼ Function scope—did you watch MatTV epsiode “Executing a
Function”?
◼ Why functions?
◼ Announcements
◼ Discussionthis week in classroom (Hollister 401) ◼ Prelim 1 Tues 3/10 at 7:30pm. Tell us now if you have an exam
- conflict. Email Amy Elser <ahf42@cornell.edu> with your conflict
info (course no., instructor email, conflict time, etc.)
SLIDE 2
c= input('How many concentric rings? '); d= input('How many dots? '); % Put dots btwn circles with radii rRing and (rRing-1) for rRing= 1:c % Draw d dots for count= 1:d % Generate random dot location (polar coord.) theta= _______ r= _______ % Convert from polar to Cartesian x= _______ y= _______ % Use plot to draw dot end end
[x,y] = polar2xy(r,theta); Review
function [x, y] = polar2xy(r, theta) % Convert polar coordinates (r,theta) to % Cartesian coordinates (x,y). % theta is in degrees. rads= theta*pi/180; % radian x= r*cos(rads); y= r*sin(rads);
polar2xy.m
SLIDE 3
Two perspectives: User vs. Provider
User wants to write:
% Generate random polar position dist= r0 + (r1 – r0)*rand(); angle= 360*rand(); % Convert position to Cartesian [xDart, yDart]= ... polar2xy(dist, angle); % Mark position with red circle plot(xDart, yDart, 'ro')
Provider must write:
function [x,y] = polar2xy(r,th) % Convert polar coordinates to Cartesian % r is radius, th is angle in degrees. rads= th*pi/180; x= r*cos(rads); y= r*sin(rads);
SLIDE 4
function [x, y] = polar2xy(r, theta) Output parameter list enclosed in [ ] Function name (This file’s name is polar2xy.m) Input parameter list enclosed in ( ) ... [ret1, ret2]= polar2xy(arg1, arg2); ... Call example (invocation): [user] Header example (declaration): [provider]
SLIDE 5 General form of a user-defined function [provider] function [out1, out2, …] = functionName (in1, in2, …) % 1-line comment to describe the function % Additional description of function and parameters Executable code that at some point assigns values to output parameters out1, out2, …
◼ in1, in2, … are defined when the function begins execution.
Variables in1, in2, … are called function parameters and they hold the function arguments used when the function is invoked (called).
◼ out1, out2, … are not defined until the executable code in the
function assigns values to them.
SLIDE 6
Comments in functions
◼ Block of comments after the function header is
printed whenever a user types help <functionName> at the Command Window
◼ 1st line of this comment block is searched whenever a
user types lookfor <someWord> at the Command Window
◼ Every function should have a comment block after the
function header that says concisely what the function does and what the parameters mean
SLIDE 7
Returning a value ≠ printing a value
function [x, y] = polar2xy(r, theta)
% Convert polar coordinates (r,theta) to % Cartesian coordinates (x,y). Theta in degrees.
x= …; y= …; % Convert polar (r1,t1) to Cartesian (x1,y1) r1= 1; t1= 30; [x1, y1]= polar2xy(r1, t1); plot(x1, y1, 'b*') …
You have this function: [provider] Code to call the above function: [user]
SLIDE 8
Returning a value ≠ printing a value
function [x, y] = polar2xy(r, theta)
% Convert polar coordinates (r,theta) to % Cartesian coordinates (x,y). Theta in degrees.
fprintf('x= %f; y= %f\n', …, …) % Convert polar (r1,t1) to Cartesian (x1,y1) r1= 1; t1= 30; [x1, y1]= polar2xy(r1, t1); plot(x1, y1, 'b*') …
You have this function: [provider] Code to call the above function: [user]
SLIDE 9
% Given f and n d= convertLength(f, n); d= convertLength(f*12 + n); d= convertLength(f + n/12); x= min(convertLength(f, n), 1); y= convertLength(pi*(f + n/12)^2);
A: 1 B: 2 C: 3 D: 4 function m = convertLength(ft, in) % Convert length from feet (ft) and inches (in) % to meters (m). . . . Given this function header: How many proper calls to convertLength() are shown below? E: 5 or 0
SLIDE 10 Functions step-by-step
1.
Identify candidates
◼
Look for opportunities to reuse logic or improve clarity
2.
Design interface
◼
Name, inputs, outputs, side effects
3.
Implement function
◼
“Write code”
4.
Test
◼
Try it out (and try to break it)
5.
Use
SLIDE 11 Reasons to use functions
◼ Code can be reused ◼ Easier to test ◼ Clearer to read
◼ Reflects top-down design
◼ Separates concerns (“what” vs. “how”)
◼ Can divide work
◼ More maintainable
[user] [provider]
SLIDE 12
c= input('How many concentric rings? '); d= input('How many dots per ring? '); % Put dots btwn circles with radii rRing and (rRing-1) for rRing = 1:c % Draw d dots for count = 1:d % Generate random dot location (polar coord.) % Convert coord from polar to Cartesian % Use plot to draw dot end end
Each task becomes a function that can be implemented and tested independently Demo
SLIDE 13
Accessing your functions For now*, put your related functions and scripts in the same directory. dotsInRings.m randDouble.m polar2xy.m drawColorDot.m
*The path function gives greater flexibility
MyDirectory Any script/function that calls polar2xy.m
SLIDE 14
Subfunctions, aka “local functions”
◼ There can be more than one function in an m-file ◼ top function is the main function and has the name of the file ◼ remaining functions are subfunctions, accessible only by the functions in the
same m-file
◼ Each (sub)function in the file begins with a function header ◼ Keyword end is not necessary at the end of a (sub)function, but if you use it,
use it consistently
SLIDE 15 Reasons to use functions
◼ Code can be reused ◼ Easier to test ◼ Clearer to read
◼ Reflects top-down design
◼ Separates concerns (“what” vs. “how”)
◼ Can divide work
◼ More maintainable
SLIDE 16 Facilitates top-down design
- 1. Focus on how to draw the figure given just a
specification of what the function DrawStar does.
- 2. Figure out how to implement DrawStar.
SLIDE 17 To specify a function… … you describe how to use it, e.g., function DrawStar(xc,yc,r,c) % Adds a 5-pointed star to the % figure window. Star has radius r, % center(xc,yc) and color c where c % is one of 'r', 'g', 'y', etc.
Given the specification, the user of the function doesn’t need to know the detail
- f the function—they can just use it!
SLIDE 18 To implement a function…
… you write the code so that the function “lives up to” the
r2 = r/(2*(1+sin(pi/10))); for k=1:11 theta = (2*k - 1)*pi/10; if rem(k,2) == 1 x(k) = xc + r*cos(theta); y(k) = yc + r*sin(theta); else x(k) = xc + r2*cos(theta); y(k) = yc + r2*sin(theta); end end fill(x,y,c)
SLIDE 19 Reasons to use functions
◼ Code can be reused ◼ Easier to test ◼ Clearer to read
◼ Reflects top-down design
◼ Separates concerns (“what” vs. “how”)
◼ Can divide work
◼ More maintainable
SLIDE 20 Software Management
Today: I write a function ePerimeter(a,b) that computes the perimeter of the ellipse During this year: You write software that makes extensive use of ePerimeter(a,b). Imagine hundreds of programs that call (use) ePerimeter Next year: I discover a better way to approximate ellipse
- perimeters. I change the implementation of
ePerimeter(a,b). You do not have to change your programs that call function ePerimeter at all.
1
2 2
= + b y a x
SLIDE 21 Script vs. Function
◼ A script is executed line-by-
line just as if you are typing it into the Command Window
◼ The value of a variable in a
script is stored in the Command Window Workspace
◼ A function has its own private
(local) function workspace that does not interact with the workspace of other functions or the Command Window Workspace
◼ Variables are not shared
between workspaces even if they have the same name
Did you watch MatTV?
Episode XV:
Executing a Function
SLIDE 22
x= 1; x= f(x + 1); y= x + 1; disp(y) function y = f(x) y= x + 1; x= x + 2; Trace 1: What is displayed? A: 1 B: 2 C: 3 D: 4 E: 5
Function f memory space Script’s memory space