
Integrated Monitoring Report (IMR) Fabry/Konnan Fabry/Konnan - PowerPoint PPT Presentation
Integrated Monitoring Report (IMR) Fabry/Konnan Fabry/Konnan February 20, 2014 February 20, 2014 Presentation Outline: 3 Parts of IMR Part A: Water Quality Monitoring ( MRP C.8 ) Part B: PCB & Mercury Loads Reduced via Stormwater
Integrated Monitoring Report (IMR) Fabry/Konnan Fabry/Konnan February 20, 2014 February 20, 2014
Presentation Outline: 3 Parts of IMR Part A: Water Quality Monitoring ( MRP C.8 ) Part B: PCB & Mercury Loads Reduced via Stormwater Control Measures ( MRP C.11/12 ) Part C: PCB & Mercury Load Reduction Opportunities ( MRP C.11/12 ) All Three Parts Due to RWQCB on March 15.
IMR Part A
IMR Part A – Water Quality Monitoring Develop and submit a comprehensive analysis of all water quality monitoring data collected pursuant to MRP Provision C.8. Submit a budget summary and recommendations for future monitoring for each requirement. Submitted as part of the Report of Waste Discharge for permit reissuance (by reference).
Creek Status Monitoring Management Questions • Are conditions in local receiving water supportive of or likely supportive of beneficial uses? • Are water quality objectives being met?
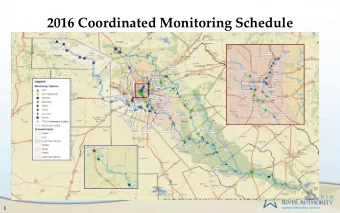
Creek Status Monitoring Sampling Stations (first 2 years)
Creek Status Monitoring Results Overall Urban Non-Urban Category (n = 23) (n = 16) (n = 7) Very Good 22% 6% 57% Good 22% 19% 29% Fair 13% 13% 14% Poor 9% 13% 0% Very Poor 35% 50% 0%
Creek Status Monitoring Results Trigger Exceedances during first two years (follow-up Monitoring Projects: ID sources & controls): Parameter Creek Bioassessment 43% overall and 63% urban. One sample in each of 3 creeks: Calera Creek, Belmont Chlorine Creek, Arroyo Ojo de Agua. 13% of sites overall. Dissolved San Mateo Creek (De Anza Park) Oxygen Pathogen Belmont Creek, San Mateo Creek , Arroyo Ojo de Agua, Indicators Pilarcitos Creek, San Pedro Creek Triggers not exceeded for other parameters: nutrients, toxicity, metals, temperature, pH.
Pollutant of Concern Loads Monitoring Pollutant loads to Bay from local watersheds, long- term trends, TMDL allocations: 1. Guadalupe River (SCVURPPP) 2. Sunnyvale East Channel (RMP) 3. Lower San Leandro (ACCWP) 4. Lower Marsh Creek (CCCWP) 5. Pulgas Creek Pump Station (SMCWPPP) 6. North Richmond Pump Station (RMP)
WQ Monitoring – Important Issues Worth all the $$$$ being spent? Informing BMPs, better management? Trends – are MRP BMPs helping over time (e.g., development requirements)? Impacts to local agencies – WQO exceedances, etc. Receiving water monitoring beats one alternative - outfall monitoring in other parts of the state.
Preliminary Costs and Benefits
IMR Part B
IMR Part B - PCB & Hg Loads Reduced via Stormwater Controls Background on TMDLs • Driven by fish consumption advisories • Mandates 90% PCB load reduction PCB & mercury uses, sources and transport Evaluates effectiveness of PCB and mercury BMPs, including status of pilot projects via MRP 1.0
IMR Part C
IMR Part C – PCB & Mercury Load Reduction Opportunities Initial analysis of types of PCB/mercury sources and their locations. New land use based PCB/mercury yields. PCB/mercury load estimates for each SM County Permittee. Preliminary evaluation of cost-effectiveness of PCBs/mercury stormwater BMPs. Future implementation scenarios for PCB/mercury controls in SM County and preliminary estimates of costs and benefits. Data gaps, uncertainties, and future information needs.
Land Use-based PCB Yields Used regression analysis to convert watershed yields to land use yields. Land Use Yield (mg/ac/yr) Old Old New Open Space Other Industrial Urban Urban 50 17.5 2 2.5 2
Old Industrial and Old Urban
Annual PCB Loading by Land Use Type for SM County Agencies New Pulgas Old Old Open Urban Creek P.S. Total Municipality Industrial Urban Space and Watershed Loading Load Other Atherton 0.4 54.3 0.3 0.0 0.0 55.0 Belmont 2.2 38.1 1.5 0.2 0.0 42.0 Brisbane 11.7 8.5 2.4 0.2 0.0 22.8 Burlingame 13.6 39.1 0.3 0.3 0.0 53.3 Colma 0.4 4.1 2.4 0.0 0.0 7.0 Daly City 1.4 35.2 0.8 0.0 0.0 37.4 East Palo Alto 4.4 20.5 0.3 0.0 0.0 25.3 Foster City 0.5 22.1 0.5 1.7 0.0 24.8 Hillsborough 0.2 58.5 1.5 0.0 0.0 60.2 Menlo Park 10.6 58.5 1.2 0.5 0.0 70.8 Millbrae 2.4 30.4 0.7 0.1 0.0 33.5 Pacifica 0.0 0.2 0.1 0.0 0.0 0.3 Portola Valley 0.1 13.1 1.3 0.4 0.0 14.9 Redwood City 15.0 80.1 2.0 2.6 0.1 99.9 San Bruno 2.4 46.3 1.6 0.0 0.0 50.3 San Carlos 8.6 42.8 1.0 0.3 84.5 137.2 San Mateo 9.1 114.8 1.4 0.7 0.0 126.0 Unincorporated SM County 13.3 74.5 25.9 4.5 0.0 118.3 South San Francisco 43.9 66.2 1.0 1.4 0.0 112.6 Woodside 0.3 52.7 5.4 0.5 0.0 58.9 Total 140.4 860.3 51.5 13.6 84.6 1150.4
Summary of Planning Level Costs and Benefits of BMPs Costs Benefits Control Measure Best Cost Metric Best Estimate Benefit Metric Estimate Street Sweeping - Mechanical $/curb-mile $48 lbs street dirt reduced/ 50 Broom swept ($33 - $50) curb-mile swept (10-160) Enhanced Municipal Operation and Street Sweeping -Regenerative $/curb-mile $80 lbs street dirt reduced/ 200 Maintenance Practices 1 Air/Vacuum Assisted swept ($29 - $81) curb-mile swept (100-240) 16,000 $25,000 lbs sediment removed/ Pump Station Maintenance $/cleanout (16,000- ($7,500 - $35,000) cleanout 123,000) Pollutant Mass Interception Control Measures lbs sediment removed/ Storm Drain Line $/linear mile of $211,000 linear mile of pipe 5.1 Cleaning/flushing pipe flushed flushed lbs street dirt reduced/ $/linear mile of $10,000 600 Street Flushing linear mile of street street flushed ($10,000 - $574,000) (240-960) flushed On-Site Stormwater Treatment $10,869 King and Hagan (2011) 3 $/acre-year N/A ($3,131 - $19,830) $25,000 73% via Retrofits 2 CW4CB Pilots 4 $/acre-year % TSS mass reduced ($8,900 - $55,000) (55-90%) 5 $13,000 64% Green Street pilot retrofits $/acre-year % TSS mass reduced ($5,700 - $22,000) (60-67%) CW4CB Pilots: Hydrodynamic $262 mass TSS $/acre Unknown 6 Separator Units ($64 - $460) reduced/acre Constructed diversion with gravity $85,000 g POC/MG 0.19 Diversion to $/year feed to POTW ($15,000 - $210,000) diverted/year (0.004-0.76) POTW 7 Constructed diversion requiring $72,500 g POC/MG 0.19 $/year pumped connection to POTW ($35,000 - $135,000) diverted/year (0.004-0.76)
Opportunity Categories High Opportunity – about 20% of PCB load • Old industrial land uses • PCBs/mercury stored, used, recycled, released • Higher concentrations and yields • Controls are most cost-effective Moderate Opportunity – about 75% of PCB load • Old urban and industrial land uses • Moderate concentrations and yields • Controls are less cost-effective Low/No Opportunity – about 5% of PCB load • Parks, open space, new or redeveloped urban land uses • Low concentrations and yields • Controls are not cost-effective
PCB Loading Scenarios
Scenario A High Opportunity Areas Percent of high opportunity area in which control measure is applied in each scenario. Control Measure A1 A2 A3 A4 10% 10% 10% 10% Source Property ID and Abatement 50% - - 45% Enhanced Street Sweeping - 50% - 45% Street Flushing Stormwater Treatment Retrofits 40% 40% 90% - 1 extra Enhanced Pump Station Maintenance - - - cleanout per year Four scenarios: implementation in High Opportunity areas in SM County over 20 years
Scenario B Moderate Opportunity Areas Green Streets Retrofits • Arterials retrofitted w/green streets over 50 years. • Includes highways such as El Camino Real. Freeways and local roads not included. Redevelopment of Parcels • Bioretention added to meet LID requirements as parcels are redeveloped over 50 years. • Applicable land uses: commercial, retail, schools, industrial & multi-family residences > 5,000 square feet. • Most of cost burden does not fall on local governments.
Scenario C Stormwater Diversions to POTWs Three scenarios: • Dry weather diversion • Passive (gravity) low flow wet weather diversion • Large pumped wet weather diversion Varying pollutant concentrations in influent Varying flow rates and volumes diverted POTW costs not included
Summary of Scenarios Opportunity Average Load Reduction Category Scenario Annual (grams) Costs Control Measures Applied within each Scenario PCBs Hg $/year 10% Source Property Abatement (PCBs Only) • A-1 50% Street Sweeping Enhancements 100 54 $2.2 M • 40% Stormwater Treatment Retrofits • 10% Source Property Abatement (PCBs Only) • A-2 50% Street Flushing 120 66 $4.3 M • High 40% Stormwater Treatment Retrofits • 10% Source Property Abatement (PCBs Only) • A-3 160 97 $4.9 M 90% Stormwater Treatment Retrofits • 10% Source Property Abatement (PCBs Only) • 45% Street Sweeping Enhancements • A-4 66 32 $2 M 45% Street Flushing • 1 Additional Pump Station Cleanout per year • B Green Street Retrofits of Arterials to treat 28 acres/year. 0.30 3.7 $360,000 Mod B Parcel re-development with bioretention treating 310 acres/year 3.8 47 $7.8 M C-1 Passive (Gravity) Low Flow Dry Weather Diversion of 86 MG/year 0.95 2.3 $50,000 All C-2 Passive (Gravity) Low Flow Wet Weather Diversion of 20 MG/year. 3.8 6.9 $35,000 C-3 Large Pumped Wet Weather Diversion of 200 MG/year. 38 69 $210,000
Recommend


More recommend
Explore More Topics
Stay informed with curated content and fresh updates.