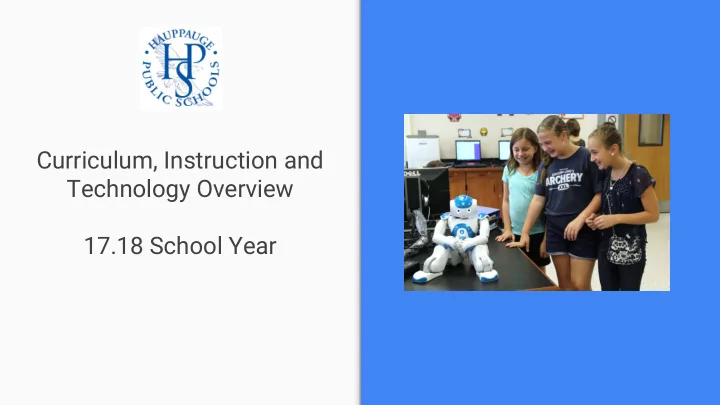

Curriculum, Instruction and Technology Overview 17.18 School Year
Hauppauge at a Glance... K-12 ● Student Count: 3,560 ● Teacher Count: 333
Elementary Enrollment History
Elementary Enrollment History Grade 2011-12 2012-13 2013-14 2014-15 2015-16 2016-17 *2017-18 Total (K-5) 1707 1654 1610 1568 1501 1417 1363 K-5 Sections 67 67 64 66 64 65 64 Class Average 25.5 24.7 25.2 23.8 23.5 21.8 21.3 K-2:26 K-3:25 Current K-5 3-5:30 4-5:28
Class Size | Elementary (K-5) 2017.18
K-5 Sections
K-5 Sections
Enrollment Projection | MS
Middle School Class Size Subject Average Class Average Class Average Class Size 15.16 Size 16.17 Size 17.18 6th grade 28.0 25.3 26.5 7th Grade ELA 29.6 26.3 25.2 8th Grade ELA 28.3 26.8 26.2 7th Grade Science 30.2 27.0 25.0 8th Grade Science 27.5 26.6 27.0 7th Grade Social Studies 29.9 27.1 25.0 8th Grade Social Studies 28.4 27.1 27.1 7th Grade Math 28.7 26.9 24.8 8th Grade Math 26.3 25.5 26.1
Enrollment Projection | HS
Enrollment Projection | HS Subject Average Class Size Average Class Size 16.17 17.18 English 22.1 24.1 Math 21.8 23.2 Social Studies 22.9 22.8 Science 20.8 21.5
Staffing LOTE Elementary K-6 ● -3.0 FLES -2.0 ● Physical Education K-12 ● -1.0
Goal Meet the academic, social and emotional needs of all students to prepare them for success in college and/or careers ● Focus on diverse course offerings for students ● Research-based PD for teachers ● Technologies that provide new opportunities Utilize data from assessments to drive instruction ●
Building Capacity “You don’t have to be bad to get better” ~ C. McKay ● RBT - The Skillful Teacher ● Mindset - C. Dweck The Danielson Framework - C. Danielson ●
The Instructional Trinity Assessments (Curriculum and) Instruction Data
The Instructional Trinity using technology tools Assessments 4.NBT.1 4.NBT.2 (Curriculum and) Instruction 4.MD.1 4.MD.2 Data 4.OA.3
Elementary Program Notes ● “FLEX” Mathematics ● Foreign Language TC ●
Teachers College K-5 ● Reading | Y3 ● Writing | Y2 Grade 6 ● Writing | Y3 Reading - Fall 2017 ●
New Course IB Computer Science SL ● 70 Students! ● Candidates will learn programming skills as a critical element of developing higher-level skills applicable to virtually all fields of study.
STEAM Goal: Empower all HPS students in K-12 to learn computer science and be equipped with the computational thinking skills they need to be creators in the digital economy
STEAM Connections ● Computer Coding ● Robotics and hands-on activities Engineering Club ● ● Science Research ● Advanced Mathematics
High School Mathematics Science Process ● Algebra I Lab ● Honors Chemistry ● Self-Select ● Geometry Lab ● IB Comp Science ● HS Rank Algebra II Lab* ● * Already in place for 16.17
High School
Data Goal | Utilize data to inform our decisions for students ● Administrative Data Meetings ● District Data Teams ● Building Data Teams ● Faculty, Department and Grade-Level Meetings ● Classroom Data ● Student Data
Collaboration, Communication and Creation Hardware tools ● 1:1 iPads - Currently grades 4 and 5 ● Other iPads - class sets, libraries ● Chromebooks - class sets, libraries ● PCs - classrooms, libraries and labs ● Interactive Boards
Google APPS for Education (GAFE) Asynchronous, device-agnostic, collaborative and integrative software
Going forward Programs Rich, Rigor, Diversity College and Career Ready Systematic self-evaluation (data) aligned with research and guided by global trends Staffing Relentless support of teachers through research-based PD
Overall IB Diploma IB Acceptance Acceptance College Name Rate Rate Boston College 32% 56% Brown University 17% 20% Carnegie Mellon 38% 72% Cornell University 29% 48% Duke University 25% 39% Johns Hopkins 35% 47% Lehigh University 44% 75% MIT 16% 24% NYU 33% 53% Princeton University 11% 17% RIT 69% 94% SUNY - Albany 56% 94% SUNY - Binghamton 42% 92% Tufts University 27% 36% US Naval Academy 12% 43% U Penn 21% 33% Villanova University 47% 76%
Up Next: - Budgetary Analysis
Recommend
More recommend