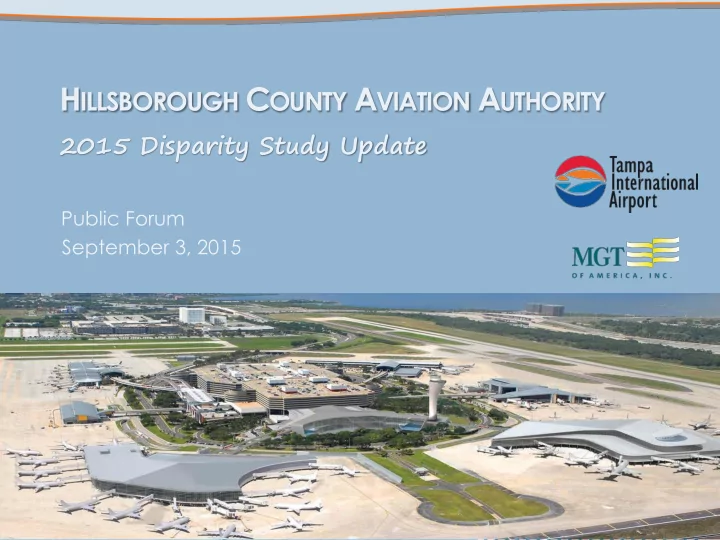

H ILLSBOROUGH C OUNTY A VIATION A UTHORITY 2015 Disparity Study Update Public Forum September 3, 2015
Presentation Outline • Project Team • Study Background • Disparity Results • Anecdotal Information • Commendations and Recommendations • Questions and Answers
Disparity Project Team MGT of America Hillsborough County Aviation Authority • Reggie Smith Executive Partner- in-Charge • Elita Cobbs-McMillon, Esq. Director of Ethics, • Vernetta Mitchell Diversity, & Project Manager Administration • Dr. Vince Eagan, J.D. Technical Advisor • Cheryl Hawkins DBE Program Manager • Marilyn Wiley Data Manager • Bonnie Yauilla DBE • Thomas Huggins Ariel Manager Business Group • Anneliese Oppenheim Oppenheim Research
Study Background Study Parameters • General contracting Construction • Runway expansions Payments made • between October • Architecture/Engineering 1, 2007 through September 30, 2012 Includes payments • Professional • Financial Services to firms located in • Legal the Tampa-St. Services • Information Technology Petersburg- Clearwater Metropolitan Statistical Area Non-Professional • Janitorial/Maintenance (Tampa MSA) MSA • Uniformed guard services Services Separate analysis • • Vehicle repair for Federally-funded spending and non- Federally-funded spending • Office goods Goods & Supplies • Equipment • Vehicles
Utilization & Availability: Federally Funded Spending BUSINESS OWNERSHIP % OF % OF Total Federally- CLASSIFICATION DOLLARS AVAILABILITY funded spending CONSTRUCTION in Construction African American 1.51% 5.83% with firms inside Native American 0.00% 0.34% of the Tampa Asian Pacific American 0.54% 2.06% MSA was Subcontinent Asian American 0.00% 0.46% $56,804,628 Hispanic Americans 6.13% 14.51% Nonminority Women 3.18% 21.60% Non-W/M/DBE Firms 88.63% 55.20%
Utilization & Availability: Non- Federally Funded Spending Total Non- BUSINESS OWNERSHIP % OF % OF CLASSIFICATION DOLLARS AVAILABILITY Federally- CONSTRUCTION funded African American 2.46% 5.83% spending in Native American 0.16% 0.34% Construction Asian Pacific American 0.28% 2.06% with firms inside Subcontinent Asian American 0.00% 0.46% of the Tampa Hispanic Americans 8.27% 14.51% MSA was Nonminority Women 3.17% 21.60% $140,513,431 Non-W/M/DBE Firms 85.65% 55.20%
Utilization & Availability: Non- Federally Funded Spending Total Non- BUSINESS OWNERSHIP % OF % OF Federally- CLASSIFICATION DOLLARS AVAILABILITY funded PROFESSIONAL SERVICES spending in African American 1.08% 15.35% Professional Native American 0.00% 1.40% Services with Asian Pacific American 0.00% 1.40% firms inside of Subcontinent Asian American 0.00% 1.40% the Tampa MSA Hispanic Americans 5.68% 8.84% Nonminority Women 1.79% 18.14% was Non-W/M/DBE Firms 91.45% 53.49% $1,671,063
Utilization & Availability: Non- Federally Funded Spending Total Non- BUSINESS OWNERSHIP % OF % OF Federally- CLASSIFICATION DOLLARS AVAILABILITY funded NON-PROFESSIONAL SERVICES spending in Non- African American 0.00% 6.31% Professional Native American 0.00% 0.90% Services with Asian Pacific American 0.09% 0.90% firms inside of Subcontinent Asian American 0.00% 0.00% the Tampa MSA Hispanic Americans 0.60% 9.01% Nonminority Women 0.26% 8.11% was Non-W/M/DBE Firms 99.05% 74.77% $49,212,228
Utilization & Availability: Non- Federally Funded Spending Total Non- BUSINESS OWNERSHIP % OF % OF Federally- CLASSIFICATION DOLLARS AVAILABILITY funded GOODS & SUPPLIES spending in African American 3.06% 7.73% Goods & Native American 0.00% 0.45% Supplies with Asian Pacific American 0.00% 0.00% firms inside of Subcontinent Asian American 0.00% 0.45% the Tampa MSA Hispanic Americans 3.43% 7.27% Nonminority Women 4.81% 8.64% was Non-W/M/DBE Firms 88.79% 75.45% $7,224,710
Disparity: Non-Federally- funded Spending • Construction – Substantial underutilization for all W/M/DBE Groups • Professional Services – Substantial underutilization for all W/M/DBE Groups • Non-Professional Service – Substantial underutilization in all W/M/DBE groups except Subcontinent Asian American due to mathematical constraint of division by zero. • Goods and Supplies – Substantial underutilization for all W/M/DBE Groups
Anecdotal Data Collection With respect to disparate treatment W/M/DBE respondents One Public reported: Hearing • Seldom or never being solicited when there were no DBE goals - 42.1% or 131 firms One Focus • An informal network precluded their firms from obtaining Group work in the private sector - 26.0% or 81 firms 31 One-on-one • Being dropped from a project after being included to interviews satisfy good faith efforts requirements - 12.9% or 40 firms 536 completed • Discrimination faced as a prime contractor - 2.6% or 8 surveys firms • Discrimination faced in the private sector - 5.22% or 28 firms • Discrimination faced as a subcontractor - 1.9% or 6 firms
Commendations & Recommendations • Commendations – Subcontractor Project Goals – W/MBE Program for Non-Federally funded spending – SBE Program – Outreach – Vendor Rotation • Recommendations – Performance Evaluations – Program Staffing
Public Forum Guidelines • Limit your comments to 5 minutes • Questions should be related to the 2015 Disparity Study Update • Comments are accepted until October 2 nd at http://www.tampaairport.com/hillsborough- county-aviation-authority-disparity-study- update
Q UESTIONS AND A NSWERS 3800 Esplanade Way, Suite 210 | Tallahassee, Florida 32311 850.386.3191 | www.mgtamer.com Follow us on Facebook at www.facebook.com/mgtdisparity
Recommend
More recommend