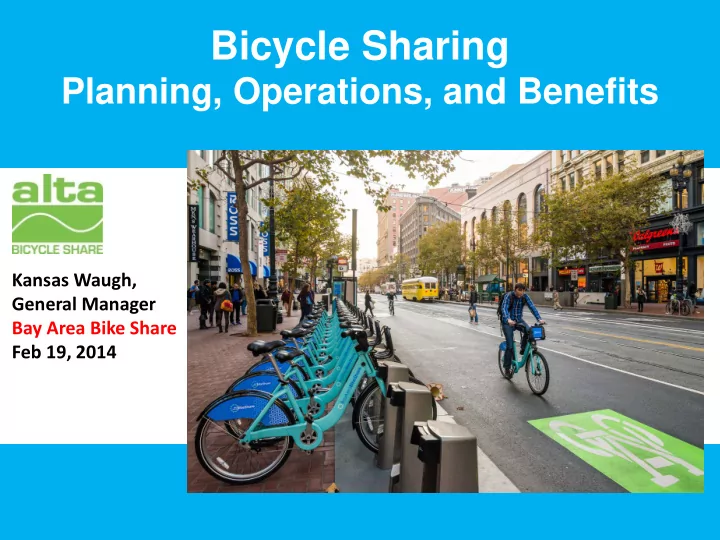

Bicycle Sharing Planning, Operations, and Benefits Kansas Waugh, General Manager Bay Area Bike Share Feb 19, 2014
Presentation Overview • Introduction to Bicycle Sharing • Planning for a Bicycle Sharing System • Operations and Data • User Characteristics
What is Bicycle Sharing? • “Personalized Mass Transit” • 1 st Generation: “Yellow Bikes” • 2 nd Generation: Coin-operated systems • 3 rd Generation: Fully automated terminals, RFID, modular, solar powered, wireless
A Global Phenomenon Source: http://bike-sharing.blogspot.com/
US Bike Sharing Doubles in 2013 Source: Earth Policy Institute
Alta’s World Class Operations 13,000 bikes worldwide • • 2 continents 200,000 members • • Over 250,000 trips per week • 18+ million miles Melbourne, Washington DC, Boston, Chattanooga, • NYC, Chicago, Columbus, Bay Area
Why Share Bikes? • Environmental Benefits • Extends range of transit system • Increases viability of other modes • Benefits local businesses
Environmental Benefits • Over 80 percent of respondents increased bike use since joining Capital Bike Share • 41 percent of members substantially reduced their use of a car • 5 million reduced VMT, annually • Reduced use of bus, metrorail, taxi
Extends Reach of Transit
Extends Reach of Transit
Extends Reach of Transit
Viability of Other Modes • Addresses “last-mile” problem – Over 50 percent of survey respondents used bike share to access a metrorail station, and 20 percent to access a bus station – Used more frequently traveling FROM transit than TO transit • Provides means for getting around during lunch hour • Provides a ride home if too late for transit
Benefits Local Businesses • Over 80 percent of respondents said they were more likely to patronize an establishment accessible by bike share • Induced Trips: – 44 percent of bike share users used Capital Bike Share to make a new trip. – 95 percent of induced trips were social trips, restaurants, entertainment, or shopping – Source: User Survey
Bay Area Bike Share Overview • Regional system – 5 service areas • Along Caltrain commute corridor • Launched August 2013 • Phased implementation • Phase 1 – 700 bicycles • Phase 2 – 1,000 bicycles • Pilot 12-24 months • Contractor - Alta Bicycle Share, Inc
• Introduction to Bicycle Sharing • Planning for a Bicycle Sharing System • Operations and Data • User Characteristics
Crowdsourcing Source: SFMTA
Site Suitability Analysis • Live – Population density • Work – Employment density • Shopping / Recreation – Retail corridors, landmarks, mixed use • Transit – Bus, subway, ferry, trains • Intersection Density – Street connectivity • Physical Geography – Slope • Methodology – Metrics used to generate a composite score. This provides a good starting point for station planning
Demand Estimation Live Work Shopping Topography
SFMTA Suitability Source: SFMTA
Preliminary Station Maps
Station Siting • Station Design Guidelines – General Siting Requirements • Clear Path • Obstacles – Relocate or Not • Distance from Utilities • On-Street Regulations – Minimum / Maximum Station Size – Solar Exposure – Installation Access – Maintenance Access
Plan Views
Local Permits / Licenses Source: SFMTA
Final Station List
Installation
Installation
Installation
Installation
Installation
Installation
Installation
Installation
Launch!
• Introduction to Bicycle Sharing • Planning for a Bicycle Sharing System • Operations and Data • User Characteristics
Operations – Bike Checking • Preventative on-street cleaning and maintenance • “Face” of the system • Important for liability purposes
Operations – Bike Maintenance • In-house maintenance • Proprietary tools and parts • Space needed for bike storage
Operations – Rebalancing
Operations – Marketing
System Data Source: http://bikes.oobrien.com/global.php • Real time data on every ride and user • Station technical issues, locked bike, monitor missing bikes • Useful for operations, marketing, site planning
System Data • Real time data on every ride and user • Station technical issues, locked bike, monitor missing bikes • Useful for operations, marketing, site planning
• Introduction to Bicycle Sharing • Planning for a Bicycle Sharing System • Operations and Data • User Characteristics
Capital Bike Share Use over Time Trips and Distance in Miles 100000 150000 200000 250000 50000 0 October 2010 November December January February March April May June 2011 July August September October November December January February March 2012 April May June July Trips Distance
10.0% 12.0% Time of Day 0.0% 2.0% 4.0% 6.0% 8.0% 12:00 - 1:00 1:00 - 2:00 2:00 - 3:00 3:00 - 4:00 4:00 - 5:00 5:00 - 6:00 AM 6:00 - 7:00 7:00 - 8:00 8:00 - 9:00 9:00 - 10:00 10:00 - 11:00 11:00 - 12:00 12:00 - 1:00 1:00 - 2:00 2:00 - 3:00 3:00 - 4:00 4:00 - 5:00 5:00 - 6:00 PM 6:00 - 7:00 7:00 - 8:00 8:00 - 9:00 9:00 - 10:00 10:00 - 11:00 11:00 - 12:00
Bike Share User Survey • Conducted in 2011 and 2012 for users of Capital Bike Share • Key Findings: – Increased bicycling use among members – Bike share used most often for social trips, entertainment, errands and appointments – Members experienced an annual personal travel expense reduction of $819
Conclusion • Bike sharing systems have provided tremendous benefits to their members • Will continue to mature as an effective transportation option • Data provide powerful analytical information for transportation practitioners
Thank you! kansaswaugh@altabicycleshare.com Photo Credit: Richard Masoner
Recommend
More recommend