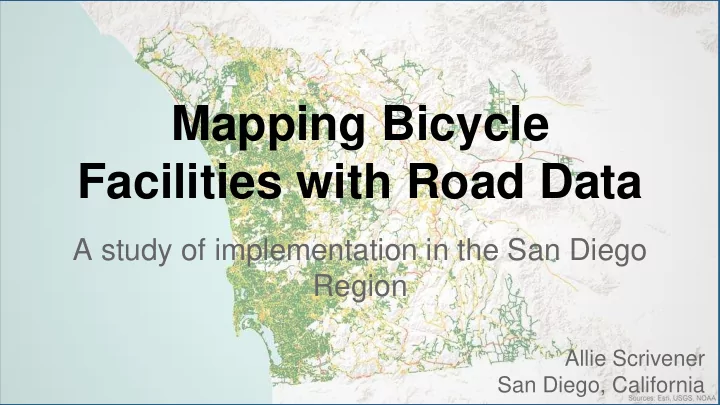

Mapping Bicycle Facilities with Road Data A study of implementation in the San Diego Region Allie Scrivener San Diego, California
Why assess bicycle facility performance?
Image Source: http://jawfirm.com/uninsured-motorist-lawsuits/
Why San Diego?
Image Source: http://www.regional-stds.com/ Image Source: https://www.criis.com/sandiego.html
Image Source: http://www.sandiego.edu/law/
Image Source: http://www.kpbs.org/news/2014/oct/28/san-diego-county-roads-and-bridges-need-billions-r/
Image Source: https://www.yelp.com/biz/spruce-street-suspension-bridge-san-diego
Source: San Diego Association of Governments (SANDAG)
Research Design
Traffic Stress Levels
LTS 1
LTS 2
LTS 3
LTS 4
Research Methods
Data
Road Network
Bicycle Network
Slope Network
Procedure
Rating System
Level 1 Traffic Stress (LTS 1) Road Types Local roads, or Class 1 Bicycle Paths Speed 0-25 mph Slope 0-15% Bicycle Class 1 - Classification Bike path, or Multi-use path
Level 1 Traffic Stress (LTS 1) Road Types Local roads, or Class 1 Bicycle Paths Speed 0-25 mph Slope 0-15% Bicycle Class 1 - Classification Bike path, or Multi-use path
Level 2 Traffic Stress (LTS 2) Road Types Light collector, or 2-lane major street, or alley Speed 26-34 mph Slope 15-20% Bicycle Class 2 - Classification Bike lane, or Class 3 - bike route
Level 3 Traffic Stress (LTS 3) Road Types Collector road, Major road, 4-lane Major road, Prime arterial Speed 35-45 mph Slope 25-50% Bicycle Classification
Level 4 Traffic Stress (LTS 4) Road Types Six-lane major street Speed 46+ mph Slope >50% Bicycle Classification
Findings
LTS 1
LTS 2
LTS 3
LTS 4
Origin-Destination Matrix
Places Network
LTS 1
LTS 1-2
LTS 1-3
Origin-Destination Findings
LTS 1 Origin-Destination Matrix
LTS 1-2 Origin-Destination Matrix
LTS 1-3 Origin-Destination Matrix
LTS 1-4 Origin-Destination Matrix
Questions? Allie Scrivener acscrive@gmail.com @AllieScrivener
Recommend
More recommend