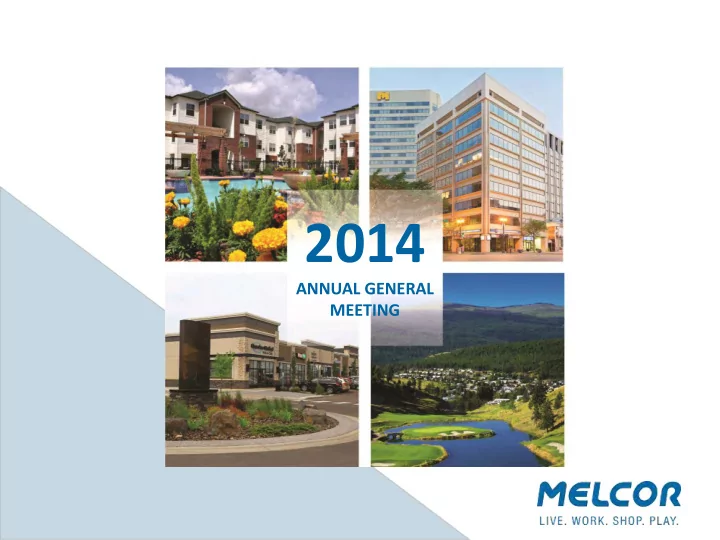

2014 ANNUAL GENERAL MEETING
AGENDA Formal Business Introductions Call to Order Presentation of Financial Statements Fixing the Size of the Board Election of Directors Appointment of Auditors Management Presentations Q&A
INTRODUCTIONS – DIRECTORS Gordon Clanachan Ross Grieve Andrew Melton Timothy Melton Edmonton, AB Edmonton, AB Calgary, AB Edmonton, AB Eric Newell Catherine Roozen Allan Scott Ralph Young Edmonton, AB Edmonton, AB Edmonton, AB Edmonton, AB
INTRODUCTIONS – EXECUTIVE TEAM Brian Baker Jonathan Chia Darin Rayburn President & CEO CFO Executive Vice President Jason Fjeldheim Dennis Inglis Brett Halford Naomi Stefura VP, Community VP, Community VP, Recreational VP, Finance Development North Development South Properties
AGENDA Formal Business Introductions Call to Order Presentation of Financial Statements Fixing the Size of the Board Election of Directors Appointment of Auditors Management Presentations Q&A
DIRECTOR NOMINEES Gordon Clanachan Ross Grieve Andrew Melton Timothy Melton Edmonton, AB Edmonton, AB Calgary, AB Edmonton, AB Eric Newell Catherine Roozen Allan Scott Ralph Young Edmonton, AB Edmonton, AB Edmonton, AB Edmonton, AB
AGENDA Formal Business Introductions Call to Order Presentation of Financial Statements Fixing the Size of the Board Election of Directors Appointment of Auditors Management Presentations Q&A
OUR STORY
MANAGEMENT PRESENTATIONS Financial Highlights Jonathan Chia – CFO Strategic & Operations Brian Baker President & CEO Highlights Brian Baker – President & CEO Shareholder Questions Jonathan Chia CFO
Jonathan Chia, CFO FINANCIAL HIGHLIGHTS
FORWARD LOOKING STATEMENTS This presentation contains statements that are forward-looking. Forward-looking statements are disclosures regarding possible events, conditions, or results of operations that are based on assumptions about future economic conditions, courses of action and include future-oriented financial information. These statements represent Melcor’s intentions, plans, expectations, and beliefs and are based on our experience and our assessment of historical and future trends, and the application of key assumptions relating to future events and circumstances. Future-looking statements may involve, but are not limited to, comments with respect to our strategic initiatives for 2015 and beyond, future development plans and objectives, targets, expectations of the real estate, financing and economic environments, our financial condition or the results of or outlook of our operations. By their nature, forward-looking statements require assumptions and involve risks and uncertainties related to the business and general economic environment, many beyond our control. There is significant risk that the predictions, forecasts, valuations, conclusions or projections we make will not prove to be accurate and that our actual results will be materially different from targets, expectations, estimates or intentions expressed in forward-looking statements. We caution readers of this document not to place undue reliance on forward- looking statements. Assumptions about the performance of the Canadian and US economies and how this performance will affect Melcor’s business are material factors we consider in determining our forward-looking statements. For additional information regarding material risks and assumptions, please see the discussion under Business Environment and Risks in our annual MD&A. Investors and others should carefully consider these factors, as well as other uncertainties and potential events, and the inherent uncertainty of forward-looking statements. Except as may be required by law, we do not undertake to update any forward-looking statement, whether written or oral, made by Melcor or on its behalf.
2014 FINANCIAL HIGHLIGHTS ($000s) 2014 2013 Change Revenue 313,009 303,742 3.1% Fair value adjustment 12,828 47,571 (73.0%) Net income 100,719 98,623 2.1% Funds from operations 85,477 57,859 47.7% Shareholders’ equity 901,335 769,231 17.2% Total assets 1,863,296 1,727,933 7.8%
2014 FINANCIAL HIGHLIGHTS $ per share 2014 2013 Change Basic earnings 3.18 3.24 (1.9%) Funds from operations 2.70 1.90 42.1% Book value 27.22 25.03 8.7% Average share price 22.98 19.04 20.7% Dividends paid 0.58 0.50 16.0% * Regular dividend only. In 2013, a $0.50 special dividend was also paid following the REIT IPO.
A RECORD YEAR 4 th consecutive record for revenue Gross margin improvement to 48% Competitive financing environment Strong financial position Positioned for the future.
Brian Baker, President & CEO STRATEGIC HIGHLIGHTS
OIL PRICE since January 2014
2014
total asset value
raw land
under management
touched
touched
$350 $2,000 $1,800 $300 $1,600 $250 $1,400 $1,200 $200 $1,000 $150 $800 $600 $100 $400 $50 $200 $- $- 2010 2011 2012 2013 2014 2010 2011 2012 2013 2014 $1,000 $80 $900 $70 $800 $60 $700 $50 $600 $500 $40 $400 $30 $300 $20 $200 $10 $100 $- $- 2010 2011 2012 2013 2014 2010 2011 2012 2013 2014
Our Value Chain CAPITAL LAND DEVELOPMENT PROPERTY INVESTMENT REIT DEVELOPMENT PROPERTIES WORK SHOP RESIDENTIAL RECREATIONAL DEVELOPMENT PROPERTIES PLAY LIVE
COMMUNITY DEVELOPMENT
PROPERTY DEVELOPMENT
INVESTMENT PROPERTIES
REIT
Our Value Chain CAPITAL LAND DEVELOPMENT PROPERTY INVESTMENT REIT DEVELOPMENT PROPERTIES WORK SHOP RESIDENTIAL RECREATIONAL DEVELOPMENT PROPERTIES PLAY LIVE
2014 HIGHLIGHTS revenue
2014 HIGHLIGHTS income
2014 HIGHLIGHTS growth
2014 HIGHLIGHTS margin
2014 HIGHLIGHTS over 5 years $0.25 $0.58 2009 2014
2014 HIGHLIGHTS from operations
2014
RAW LAND ACTIVE LAND DEVELOPED
single family
commercial development
played
Revenue & Earnings Since 1986 WITH MAJOR OIL CORRECTIONS
$350 $300 $250 $200 $150 $100 $50 $- 2010 2011 2012 2013 2014
2015
Protect & Grow Shareholder Investment $1,000 $900 $800 $700 $600 $500 $400 $300 $200 $100 $- 2010 2011 2012 2013 2014
2000 2014 2000 2014 by division by country
Protect Grow Shareholder Shareholder Investment Value FUNDAMENTAL GOALS Distribute Profit Care for Our to Shareholders Exceptional Team
The Golden Deep & Traditional Rule Lasting Values Relationships
OUR STORY
QUESTIONS & ANSWERS
Recommend
More recommend