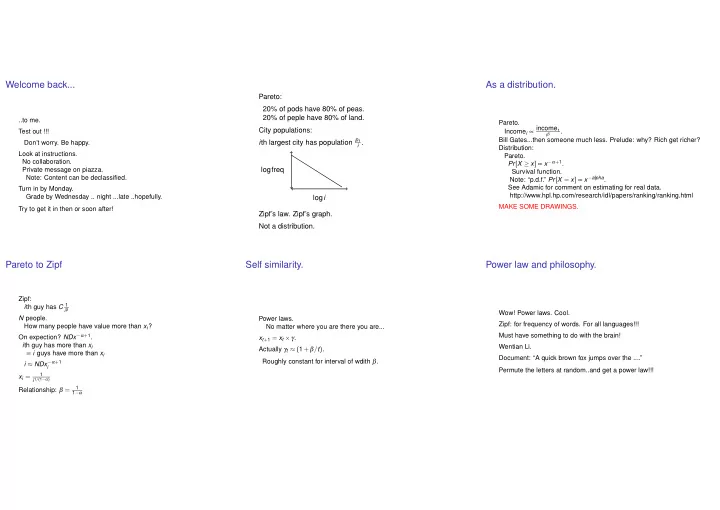

Welcome back... As a distribution. Pareto: 20% of pods have 80% of peas. 20% of peple have 80% of land. ..to me. Pareto. Income i ∝ income 1 City populations: Test out !!! . i β i th largest city has population p 1 Bill Gates...then someone much less. Prelude: why? Rich get richer? i . Don’t worry. Be happy. Distribution: Look at instructions. Pareto. No collaboration. Pr [ X ≥ x ] ∝ x − α + 1 . Private message on piazza. logfreq Survival function. Note: Content can be declassified. Note: “p.d.f.” Pr [ X = x ] ∝ x − alpha . See Adamic for comment on estimating for real data. Turn in by Monday. http://www.hpl.hp.com/research/idl/papers/ranking/ranking.html Grade by Wednesday .. night ...late ..hopefully. log i MAKE SOME DRAWINGS. Try to get it in then or soon after! Zipf’s law. Zipf’s graph. Not a distribution. Pareto to Zipf Self similarity. Power law and philosophy. Zipf: i th guy has C 1 i β Wow! Power laws. Cool. N people. Power laws. Zipf: for frequency of words. For all languages!!! How many people have value more than x i ? No matter where you are there you are... Must have something to do with the brain! On expection? NDx − α + 1 . x t + 1 = x t × γ . i th guy has more than x i Wentian Li. Actually γ t ≈ ( 1 + β / t ) . ≡ i guys have more than x i Document: “A quick brown fox jumps over the ....” Roughly constant for interval of wdith β . i ≈ NDx − α + 1 i Permute the letters at random..and get a power law!!! 1 x i = i 1 / ( 1 − α ) 1 Relationship: β = 1 − α
Polya Urns Permutations More bins. r + 1 Choose bin with probability r + b + 2 . 1 Claim: After n balls the Pr [ i red ] = n + 1 . Analyse?Another process. m bins. Choose bin uniformly at random. Start with two balls, insert n more. Uniformly at random. Load on red bin? � 5 $ $ x x x Max load: n n Expectation? n / 2 4 4 2 2 2 2 2 1 1 1 1 1 3 3 3 m log n m + Within n / 2 ±√ n with good probability. � Approximately Gaussian with variance √ n / 2 Min load: n n Where is ball 1? Position 4. m log n m − How many red balls? 3. Preferential Selection: r + 1 Choose red bin with probability r + b + 2 Insert n balls, where oh where is ball 1? Max load: n m log n Expectation? n / 2 1 Random permuation. Position i ∈ [ 1 , n + 1 ] with prob. Min load: n / m 2 n + 1 Distribution? 1 How many red balls? j = i − 1 ∈ [ 0 , n ] with prob. n + 1 . Guesses? Analysis: random permutation with m separators. Uniform! !!! Balls in bins? Yes! Analyse min and max size of interval. 5 Allocation ( r , b ) : Roughly: ( 1 / m ) probability of stopping at any point. choose one of r + b balls or 2 bottoms. 4 place in corresponding bin. 2 3 r + 1 Pr[red] = r + b + 2 Red balls have same distribution in two processes. Internet: copy links. Routers. Router Graph: Average degree: 4 Connection Game. ⇒ Pr [ degree ≥ 20 ] ≈ 10 − 4 . Max Degree? Uniformly random = Process Distance: Actual high degree nodes more common: Arrive randomly at point on unit square. 5% of nodes have degree greater than 20. Connect to closest node. Surf. Cool page. Link for mine. Internet graph: Generate tree with average degree 1. Average degree: 12. Model: Max degree? O ( log n ) . Degree ≥ 100 with prob. ≤ 10 − 6 . Pick a random neighbor. Actual: 1 % greater than 100. Process Hops: Copy all links. Some very large. Arrive randomly at point on unit square. Random Graph with average degree 4. Plus Copy process → √ n Connect to first node. Processes? Preferential Attachment. Max degree? n − 1. For routers? Process Distance/Hops: Connect at random. Not! Arrive randomly at point on unit square. For the internet graph? Connect to node with min j < i α d ij + h j . Degrees too large for even that. Power law if c ≤ α ≤ √ n , → power law!
See you ... Thursday.
Recommend
More recommend