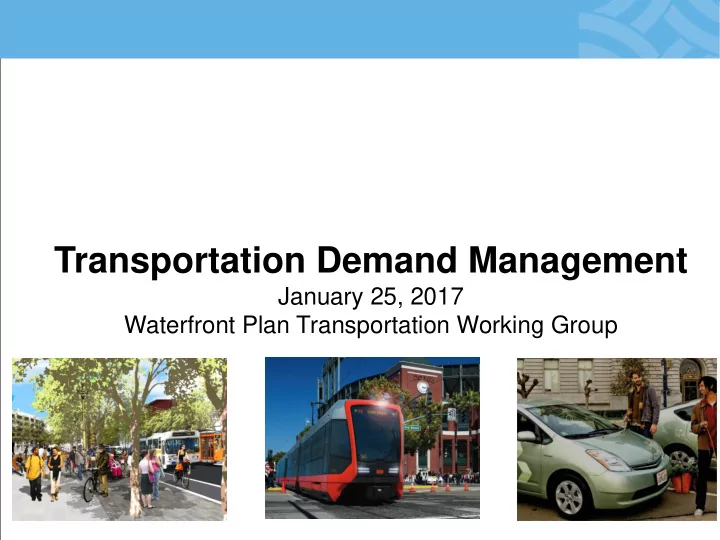

Transportation Demand Management January 25, 2017 Waterfront Plan Transportation Working Group Date & Location
TDM Opportunities: Port Uses • Visitor-serving uses Many TDM • Port tenants Opportunities • Future development • PDR Limited TDM • Industrial maritime uses Opportunities • Storage uses
TDM Ordinance Basics Points Target Menu of Options Implementation Strategy Aimed at reducing Vehicle Project sponsor chooses Measure and enforce Miles Traveled (VMT) the best fit for each project progress to ensure to reach targets targets are achieved
TDM Program Menu of Options 66 Options: Under the control of the • developer or property owner R educe site users’ vehicle miles • traveled (VMT) Points reflect relative efficacy in • reducing site user VMT
Policy Suggestions • Auto Trip Cap – Related to City Climate Action Strategy (80% of trips by non-driving modes by 2030) – Consider Port-wide and by sub-area – Design TDM program(s) to meet these • Establish Port-wide TDM Program designed to support tenant and visitor trips • Parking supply & management – Link approach to TDM goals
SFMTA Parking Policies • SFMTA sets policies and rates for: – All on-street parking in the City, outside of areas controlled by other entities – 38 parking garages and lots 7
On-Street Parking • Manage parking to maintain availability – In areas of high demand, people stay only as long as they need • Four basic regulation types 8
On-Street Parking • Parking regulations in different contexts – Commercial, retail, industrial, or mixed-use – Residential – Public spaces 9
Off-Street Parking • Prices set to promote use for short-term over long-term parking • Prices competitive with nearby meters to draw people into garages 10
SF park program • Demand-responsive to find lowest possible prices • Gradual and periodic changes: $0.25 up or down (or no change) every quarter • Time of day pricing (vary by block + weekday/weekend) 11
Parking at the Port of San Francisco On-Street Parking: Time Restricted Areas Metered Parking Stalls Off-Street Parking: Parking Lot Operators Tenant Parking Stalls 12
On-Street Parking: Overview SFMTA Partnership Design & Maintenance Signage & Striping Traffic & Parking Enforcement SFPark Meter Program No-Stopping Signage Program Master Street Parking Plan Unrestricted Parking Time Restricted Zones Color Curb Zones Metered Parking Stalls 13
On-Street Parking: Regulations Time Restrictions Street Cleaning 2/4/6 Hour Restrictions High Traffic Zones No Parking Anytime Color Curbs White Zones Red Zones Yellow Zones Blue Zones 14
On-Street Parking: Meters SFPark Program Survey & Planning Meter Installation Signage & Striping Meter Maintenance Demand Responsive Pricing Enforcement 15
On-Street Parking: Meters (continued) Portfolio Meters Fisherman’s Wharf 79 Northern Area 345 Central Area 113 Southern Area 574 Total 1111 16
Off-Street Parking: Lots Third Party Operators Central Parking System China Basin Ballpark Co. LLC. Ferry Building Investors, LLC. Imperial Parking (U.S.), Inc. Standard Parking, LLC. SP+ & Hyde Parking Inc. 17
Off-Street Parking: Lots (continued) Portfolio Facilities Stalls Fisherman’s Wharf 4 530 Northeast 7 1,013 Waterfront Ferry Plaza/ South 5 1,144 Beach China Basin & 5 2,575 Central Basin Southern Waterfront 2 275 Total Parking 23 5,537 Lots 18
Off-Street Parking: Stalls Parking Stall Location Stalls Commercial Tenant Stalls Pier 9 30 Pier 17 6 Ag. Building 4 SWL 302 6 SWL 303 3 59 19
Off-Street Parking: Stalls (continued) Parking Stall Location Stalls Industrial Trucking Stalls Pier 80 15 Pier 90 53 Pier 94 41 Pier 96 122 231 20
Parking in Recent Port Development Ferry Building 240,000 sf, 127 Piers 1.5, 3, & 5 77,000 sf, 25 dedicated spaces (Seawall Lot 351) dedicated spaces Pier 1 140,000 sf, no dedicated parking Exploratorium 330,000 sf, 200 dedicated spaces (SWL 321) Pier 70 Historic Core 300,000 sf, 69 spaces 21
Parking Revenue History $25. M $20. M $15. M $10. M $5. M $. M FY2013 FY2014 FY2015 FY2016 FY2017 (Projected) Parking Lots $13.1 M $12.3 M $13.5 M Parking Meters $5.1 M $5.4 M $5.4 M Parking Fines $3.5 M $3.1 M $3.7 M Parking Stalls $.5 M $.5 M $.5 M Total Real Estate $22.2 M $21.3 M $23.1 M Parking 22
Waterfront Land Use Plan Update Evaluating transportation demand management options for the Port Transportation Subcommittee Meeting January 25, 2017 23
Goals of Evaluation Understand what parking and transportation demand management (TDM) strategies the Port could pursue that: Ensure convenient access Sustain Port revenues Help achieve greenhouse gas reductions Ensure collaboration and consistency with City policy 24
Consultant Tasks Purpose: Evaluate and recommend strategies for managing Port parking resources Evaluate and recommend strategies for a TDM program Recommend TDM implementation strategy Tasks: Data collection, review, and analysis to establish baseline, including how Port parking resources are used today SWL 332-1 & 324 subarea study to analyze impacts of parking loss Recommendation of a proposal designed for the Port and Port tenants 25
Conclusion Evaluation will generate data- driven Port-focused TDM and parking management strategies for the Port to pursue. Timeline: TBD, tentatively July 1 Thank you • ~~~~ 26
Next Steps • Initiate transportation study • Report back to Working Group on February 15 • Staff to generate policy ideas for Subcommittee review and discussion • Next Transportation Subcommittee, March 8 (to be confirmed), begin discussing proposed transportation policies for Waterfront Plan Update • Per suggestion from Subcommittee Chair, staff to develop proposed transportation-related capital priorities for Subcommittee consideration 27
Recommend
More recommend