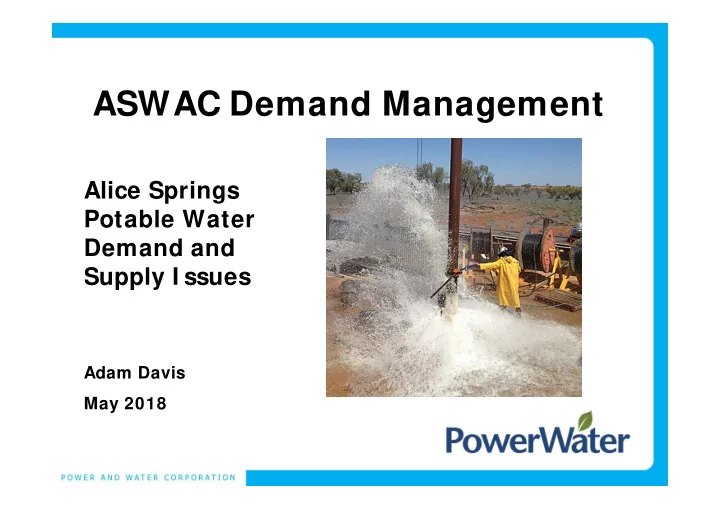

ASWAC Demand Management Alice Springs Potable Water Demand and Supply I ssues Adam Davis May 2018
Alice Springs Peak Day Demand Water Demand (ML/ day) 30.00 35.00 40.00 45.00 50.00 55.00 60.00 1980 1982 1984 1986 1988 1990 1992 1994 1996 1998 2000 2002 2004 2006 2008 2010 2012 2014 2016 2018
Cost Drivers – Peak Day/ Hour • Infrastructure capacity is required to meet peak day demand • i.e. bores, pumps, pipelines, tanks all need to be big enough to meet peak day demand. This is expensive infrastructure. • Capacity only used for a few days a year • Similar issues to why large power customers have peak/off peak tariffs, to try and flatten the demand curve. • Not currently a major issue as the bulk of the existing infrastructure is built for historical peaks so there is some spare capacity in the system
Alice Springs Annual Demand Annual Production and Population 13000.0 38000 12000.0 36000 11000.0 34000 Annual Production (ML) Population 10000.0 32000 9000.0 30000 8000.0 28000 7000.0 26000 6000.0 24000 1980 1982 1984 1986 1988 1990 1992 1994 1996 1998 2000 2002 2004 2006 2008 2010 2012 2014 2016 2018 2020 Annual Production ML/yr Population (Alice Springs Local Government Area, ABS)
Mereenie Aquifer Rate of Decline 450.00 400.0 440.00 350.0 Bore at Finke start finish approx 4km from borefield 430.00 300.0 420.00 250.0 Groundwater Level (mAHD) Monthly Rainfall (mm) 410.00 200.0 400.00 150.0 390.00 100.0 380.00 50.0 370.00 0.0 11/4/72 11/4/75 10/4/78 9/4/81 8/4/84 8/4/87 7/4/90 6/4/93 5/4/96 5/4/99 4/4/02 3/4/05 2/4/08 2/4/11 1/4/14 31/3/17 30/3/20
Cost Drivers – Annual Demand • Annual demand is the key driver on rate of decline of the aquifer • This means that older bores run out of water and are no longer useable, therefore new bores are required to be drilled. • At current demand rates, and rate of decline of aquifer levels, it is expected that no new bores will be required for at least 10 years
Carbon Emissions • CO2 emissions – Alice Springs Power Generation approx 0.6 kg C02-e/kWh. (this is dropping as the proportion of solar increases) • 1ML of water equates to 600kg CO2 • An average house in Alice uses 0.4ML/yr = 240kg CO2 • A return car trip to Adelaide = approx 900kg CO2 • PWC are investigating installing solar at the borefield to reduce both power costs and CO2 emissions (approx 20%) Reference: https://www.environment.gov.au/system/files/resources/5a169bfb-f417-4b00- 9b70-6ba328ea8671/files/national-greenhouse-accounts-factors-july-2017.pdf
Operational Costs • Majority of PWC’s operational costs (maintenance and replacement of assets) are fixed regardless of demand. • The marginal costs include: • Power - $350 per ML • Chlorine - $5 per ML • Pump Replacement/maintenance - $30 per ML • Total approx $400 per ML • The water is sold for $1,930 per ML. Therefore financially beneficial for PWC to supply more water. • An average residential bill is 25% fixed and 75% consumption based, which encourages water savings. • Water and sewer bills come together, so the consumption based charge is often masked by the additional fixed charge of the sewer bill. • PWC costs are approx 80% fixed and 20% consumption based.
Population Projections - Treasury • NT Dept of Treasury forecast is 1.4% annual growth. Note this is for the territory as a whole, not specific to Alice Springs • This would make the Alice Springs population 36,000 in 20 years time, and annual water demand up to 11,400 ML • General note, demographers do not like to project populations less than 400,000 as single projects can have a major effect. • Chart Reference https://treasury.nt.gov.au/dtf/economic-group/population-projections
Population Projections – CDU Demographer Prof Dean Carson presented at CDU on the 4 th Dec 2017 • • Compared Alice Springs to other regional centres with a capital, locations included Scandinavia and Alaska • General findings (from my notes): • Capitals are growing and regional centres are not, and this is a global trend. • This is generally due to: • Less labour required for the traditional industries of regional centres (Agriculture, farming…) • More industries operate as fly in fly out, (Consultants, Road works, major construction) • Businesses/Gov centralise staff to the major centres for efficiency • Mining generally has little impact on local economies when more than 50km from the town • Two, of very few ways to a grow regional centre, is to: • attract and retain retirees, or • build a world class university
Social Drivers • Long term sustainability of the water resource as a whole, preserving water for future generations. It is a finite resource • Awaiting model results to quantify effects of changes in demand, i.e. • Change in number of years that the resource is viable • Change in expected dates for requiring new bores to be drilled (offset of capital expenditure) • Cost to consumers – currently common pricing territory wide, so little impact in the short term, but this could change. • Lower bills – lower cost of living, especially for hardship customers
Summary • No immediate need for demand management to offset capital expenditure • Population growth, and hence water demand growth, likely to be low • Water levels at borefield are still dropping, but not as fast as previously anticipated. Awaiting model results to update forward projections • Significant energy and CO2 emissions required to pump water, but it is financially beneficial for PWC to sell more.
Recommend
More recommend