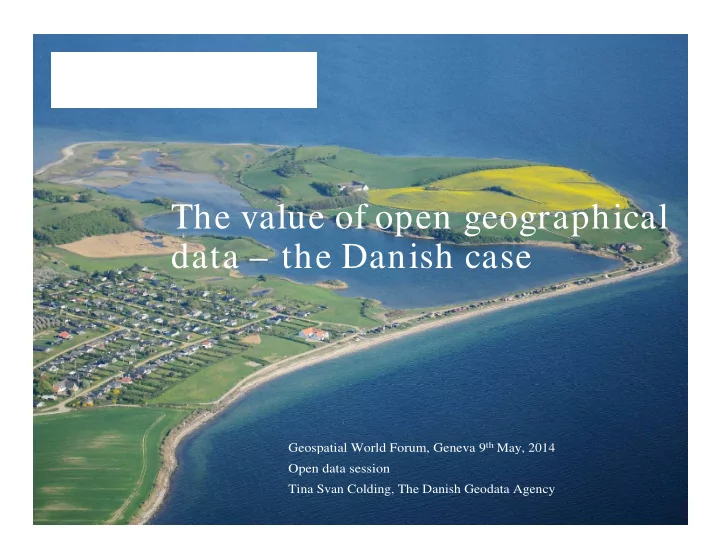

The value of open geographical data – the Danish case data – the Danish case Geospatial World Forum, Geneva 9 th May, 2014 Open data session Tina Svan Colding, The Danish Geodata Agency
Danish Geodata Agency
Basic public data Basic public data Danish Geodata Agency PAGE 3
Positive Business Case Positive Business Case Open data in Denmark is an investment Open data in Denmark is an investment •Growth in the private sector (100 mio. d.kr. pr year) •More effective public sector (‘paying the party’) •More effective public sector (‘paying the party’) Danish Geodata Agency PAGE 8
Reactions ? Reactions ? Treasure to be found in open Cadastral Map (Sille Wulff Mortensen) (Sille Wulff Mortensen) Joy over government’s data bonanza: breakthrough with open access to Central Business Register and to Central Business Register and cadastral numbers (Henrik Nordstrøm Mortensen) …growth adventure waiting for …growth adventure waiting for Danish enterprises... (Jakob Chor) PAGE 9
Meassuring the effect Meassuring the effect Effect of open data Open data Open data 2015 2015 2016 2016 2014 2014 2012 2012 2013 2013 Danish Geodata Agency PAGE 10
The Analytical Design The Analytical Design Analytical Analytical The AD is used in Design the baseline survey Content: Baseline • Change theory 2012 • Value chains • Data strategy Post - meassurement meassurement 2016 The results of the post- meassurement are compared to the are compared to the results of the baseline survey Danish Geodata Agency PAGE 11
Change theory Change theory Socio - economic Effect on demand Effect on production Effect on users effects Public sector Public sector • Efficiency (self - service, workflow) • Better decision - making • Increased in public administration • New products/ demand from services from services from existing existing Private sector existing customers • Increase in GDP • Efficiency (workflows, companies higher productivity) • Increased • Better decision - making • Increase in new • Increase in Open data demand from • Lower prices companies (low welfare, time new customers entry cost) entry cost) saved, less saved, less Consumers and pollution, better • Increased citizens Lower prices on • health … demand from • Lower prices/ increased existing products/ companies in purchasing power services other industries •Increased transparency Danish Geodata Agency PAGE 12
Value chain approach Value chain approach Information Value chain Data collection Who was using Data provider Statistics which data? (Geodata Agency) Interviews with key informants How was the data used Map provideres / Open data - Public sector data enrichment The size of the geodata The size of the geodata companies companies - Private sector marked Service and ‘Real economic‘ effects solution Surveys (productivity, …) companies - Private sector - Private sector - Public sector Welfare economic effects End users (health, environment,..) Danish Geodata Agency PAGE 13
Open data – what happened? Open data – what happened? 2012 – 800 users 2012 – 800 users Dec. 2013 > 10.000 users Danish Geodata Agency PAGE 14
Mill illions 100 120 140 20 40 60 60 80 How many? How many? 0 Januar Marts Maj Juli September Digital May Supply (Web Map Service) – 2005 - 2013 November Januar Marts Maj Juli September November Januar Marts Maj Juli September November Januar Marts Maj Juli September November Januar Marts Maj Juli September November Januar Marts Maj Juli September November Januar Marts Maj Juli September November Januar Marts Maj Juli September November Januar Marts Maj Juli SIDE 15 September November
Open data – Who are the new users? Open data – Who are the new users? Private sector sector 24% Public Public Citizens sector 66% 6% NGO NGO 3% Danish Geodata Agency PAGE 16
Companies Companies Consultancy and IT Others 37% 32% Information and communication 4% 4% Construction 14% Water , waste , etc. Water , waste , etc. Electricity , gas Electricity , gas utilities …7% utilities 4% SIDE 17
Main results – baseline 2012 Main results – baseline 2012 Barriers • Accessability and distribution • The users – capacity and knowledge • • Market insecurity Market insecurity • Lacking release of other data Danish Geodata Agency SIDE 18
Main results – baseline 2012 Main results – baseline 2012 Potentials Public sector • 40% indicate that the data will be of importance for the efficiency in the performance of tasks in 4 - 5 years efficiency in the performance of tasks in 4 - 5 years • 80% indicate that there is a savings potential in using geodata Private sector • Watch and wait – 5.5 % market growth – new positive indications indications Danish Geodata Agency SIDE 19
M A N I F E S T ….og spørgsmålet er Questions? Qu e s tio n s ? Contact: tisha@gst.dk SIDE 20 Foto: Colourbox.com
Recommend
More recommend