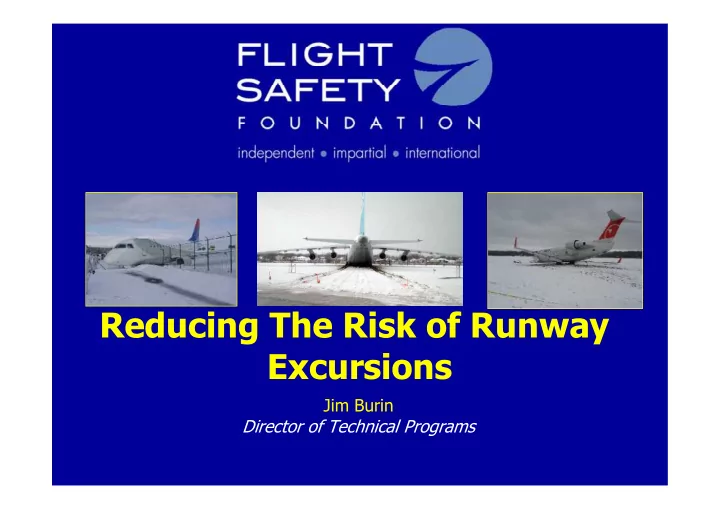

Reducing The Risk of Runway Excursions Jim Burin Director of Technical Programs
Participants Participants • Airbus • EASA • Embraer • CANSO • ACI • IFALPA • IATA • FAA/CAST • ERA • LVNL • Eurocontrol • Boeing • AAPA • DGAC France • US NTSB • Flight Safety Foundation • AEA • IFATCA • Honeywell • NLR • ALPA • ALTA
Runway Safety Issues • Runway Incursions • Runway Confusion • Runway Excursion
Runway Excursion: When the wheels of an aircraft on the runway surface depart the end or the side of the runway surface. Runway excursions can occur on takeoff or on landing. They consist of two types of events: Veer-Off: Excursion in which an aircraft departs the side of a runway Overrun: A runway excursion in which an aircraft departs the end of a runway
The Players • Aircraft Manufacturers • Operators - Aircrews - Management • Airports • ATC • Regulators
Runway Confusion Data Safety Incursion Excursion
Runway Safety Accident Data 1995–2009 1,508 Total Accidents Number Percent of Total Incursions: 10 (.7/year) .6% 1.0/year Confusion: 5 (.3/year) .3% Excursions: 442 (29.8/year) 29%
Runway Safety Data 1995–2010 Runway Excursion Data • 36% of turbojet accidents • 24% of turboprop accidents
Fatal and Non-Fatal Runway Accidents by Type, 1995 Through 2009 Fatal Runway Confusion Non-Fatal Runway Incursion Runway Excursion 0 50 100 150 200 250 300 350 400 450 Number of Accidents
Runway Excursions - Type 500 79% 450 400 Co u n t s (n= 5 4 8 ) 350 300 250 200 21% 150 FSF RSI - E Weener 100 50 0 10/19/2011 15 Takeoff Landing
Takeoff Excursions 80 63% 70 60 Co unt s (n=113) 50 37% 40 30 20 FSF RSI - E Weener 10 0 10/19/2011 16 Veer Off Overrun
Landing Excursions - Type 250 53% 47% 200 Co u n t (n= 4 3 5 ) 150 100 FSF RSI - E Weener 50 0 10/19/2011 17 Overrun Veer Off
Takeoff Excursions - Fleet Composition 50.0% 45.0% 41% 40.0% 36% 35.0% 30.0% 25.0% 17% 20.0% 15.0% 10.0% 6% 5.0% 0.0% Other Business Jets Jet Transports Turboprop
Landing Excursions - Fleet Composition 50% 43% 45% 40% 35% 35% 30% 25% 19% 20% 15% 10% 3% 5% 0% Other Business Jet Turboprop Jet Transports
Takeoff Excursions – Top 10 Factors
Landing Excursions – Top 10 Factors
Corp/Biz Aircraft vs. Full Fleet - Landing Excursions
Runway Safety Observations • Data shows we are being effective in preventing runway incursion accidents, but the number of incidents and severity still indicates a very high risk • Data shows runway excursions are the most common type of runway safety accident (96%) and the most common type of fatal runway safety accident (80%) • Severity of runway excursions dependent on: - Energy of aircraft when departing the runway - Airport layout, geography, and rescue capability
Basics - Stabilized approach with landing in touchdown zone - Energy = Mass X V 2 - Effect of reverse thrust is significantly greater on a contaminated runway - Calculations and rules are important, but so is adhering to the conditions used to calculate them: * e.g., abort past V1 * Land long, land fast
Conclusions • Unstable approaches increase the risk of landing runway excursions • Failure to recognize the need for and to execute a go-around is a major cause of landing runway excursions • Establishing and adhering to standard operating procedures (SOPs) will enhance flight crew decision making and reduce the risk of runway excursions 25
Conclusions • Contaminated runways increase the risk of runway excursions • Universal standards related to runway conditions, and comprehensive performance data related to aircraft stopping characteristics, would assist in reducing the risk of runway excursions 26
Runway Condition Reporting Runway Condition Reporting Summary of Methods Summary of Methods Runway Runway Airplane Braking Airplane Braking Runway Friction Runway Friction Description Description Action Report Action Report Report Report PIREPs PIREPs Better Braking Better Braking 80 0.8 80 0.8 ICAO FAA* FAA* ICAO Dry Good Good 60 0.6 60 0.6 Wet Measured Measured Dry Snow Packed or Runway Runway Compact Snow Friction Friction 40 0.4 40 0.4 Medium Fair Wet Snow Slush Poor Poor 20 0.2 20 0.2 Ice Nil Wet Ice * Per airline/FAA discussion as * Per airline/FAA discussion as Worse Braking Worse Braking 0 0.0 0 0.0 result of August 2006 result of August 2006 workshop in Washington, D.C. workshop in Washington, D.C.
Braking Action Chart Braking Action Chart
Runway Condition Measurement and Reporting - CFME - CRFI - Safe Land - Mu - ICAO - FAA - Tapley Meter “A single overarching source of guidance is needed for production and promulgation of runway condition information”--- ICAO
Conclusions • Combinations of risk factors (such as abnormal winds and contaminated runways or thrust reverser issues and contaminated runways) have an undesirable synergistic effect on the risk of an excursion 30
Landing Excursion Risk Factor Interactions • Overrun accidents – Go-around not conducted events • 85% Touchdown long/fast • 79% Unstabilized approach • 40% Runway contamination – Touchdown long/fast events • 85% Go-around not conducted • 72% Unstabilized approach • 50% Runway contamination – Unstabilized approach events • 97% Go-around not conducted • 89% Touchdown long/fast • 49% Runway contamination 31
Contamination + Other Factors Takeoff Excursions – contaminated runway - 75% of accidents initiated prior to V1 - 50% of accidents had adverse winds (cross, tail) Landing Excursions – contaminated runway - 55% of accidents had adverse winds (cross, tail) 32
FSF Goal: Make aviation safer by reducing the risk of an accident
Recommend
More recommend