Performance Analysis with the Projections Tool By Chee Wai Lee - PowerPoint PPT Presentation
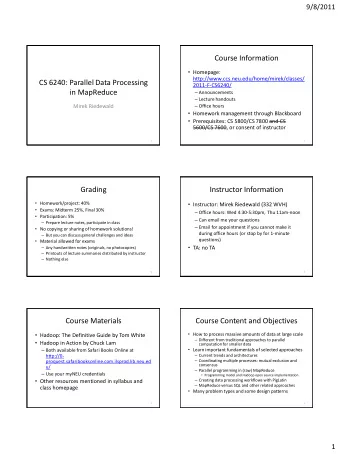
Performance Analysis with the Projections Tool By Chee Wai Lee Tutorial Outline General Introduction Instrumentation Trace Generation Support for TAU profiles Performance Analysis Dealing with Scalability and Data Volume General
Performance Analysis with the Projections Tool By Chee Wai Lee
Tutorial Outline General Introduction Instrumentation Trace Generation Support for TAU profiles Performance Analysis Dealing with Scalability and Data Volume
General Introduction Introductions to Projections Basic Charm++ Model
The Projections Framework Projections is a performance framework designed for use with the Charm++ runtime system. Supports the generation of detailed trace logs as well as summary profiles. Supports a simple user-level API for user-directed instrumentation and visualization. Java-based visualization tool. Analysis is post-mortem and human-centric with some automation support.
What you will need A version of Charm++ built without without the CMK_OPTIMIZE flag (Developers using pre-built binaries please consult your system administrators) . Java 5 Runtime or higher. Projections Java Visualization binary: Distributed with the Charm++ source (tools/projections/ bin). Build with “make” or “ant” (tools/projections) .
The Basic Charm++ Model Processor Object-Orient Object-Oriented ed : Chare objects encapsulate data and entry methods . entry method entry method foo() qsort() Message-Driv Message-Driven en : An entry method is scheduled for entry method execution on a processor bar() New when an incoming message Incoming Chare Object Chare Object is processed on a message Message queue. Scheduler : schedules appropriate Each processor executes an method for next entry method to completion message on Q before scheduling the next Message Queue one (if any).
Tutorial Outline General Introduction Instrumentation Trace Generation Support for TAU profiles Performance Analysis Dealing with Scalability and Data Volume
Instrumentation Basics Application Programmer’s Interface (API) User-Specific Events Turning Tracing On/Off
Instrumentation: Basics Nothing to do! Charm++’s built-in performance framework automatically instruments entry method execution and communication events whenever a performance module is linked with the application (see later). In the majority of cases, this generates very useful data for analysis while introducing minimal overhead/perturbation. The framework also provides the necessary abstraction for better interpretation of performance metrics for third-party performance modules like TAU profiling (see later).
Instrumentation: User-Events If user-specific events (e.g. specific code-blocks) are required, these can be manually inserted into the application code: Regis egister er : int traceRegisterUserEvent(char* EventDesc, int EventNum=-1) � Recor ecord a P d a Point-Ev oint-Event ent : void traceUserEvent(int EventNum) � Recor ecord a Br d a Brac acketed-Ev ed-Event ent : void traceUserBracketEvent(int EventNum, double StartTime, double EndTime) �
Instrumentation: Selective Tracing Allows analyst to restrict the time period for which performance data is generated. Simple Interface, but not so easy to use: void traceBegin() � void traceEnd() � Calls have a per-processor effect, so users have to ensure consistency (calls are made from within objects and there can be more than one object per processor).
Selective Tracing Example // do this once on each PE, remember we are now in an array element. � // the (currently valid) assumption is that each PE has at least 1 object. � if (!CkpvAccess(traceFlagSet)) { � if (iteration == 0) { � traceBegin(); � CkpvAccess(traceFlagSet) = true; � } � } �
Tutorial Outline General Introduction Instrumentation Trace Generation Support for TAU profiles Performance Analysis Dealing with Scalability and Data Volume
Trace Generation Performance Modules at Application Build Time Projections Event Tracing, Projections Summary Profiles TAU Profiles Application Runtime Controls The Projections Event Tracing Module. The Projections Summary Profile Module. The TAU Profile Module.
Application Build Options Link into Application one or more Performance Modules: “ -tracemode summary ” for Projections Profiles. “ -tracemode projections ” for Projections Event Traces. “ -tracemode Tau ” for TAU Profiles (see later for details).
Application Runtime Options General Options: +traceoff tells the Performance Framework not to record events until it encounters a traceBegin() API call. +traceroot <dir> tells the Performance Framework which folder to write output to. +gz-trace tells the Performance Framework to output compressed data (default is text). This is useful on extremely large machine configurations where the attempt to write the logs for large number of processors would overwhelm the IO subsystem.
The Projections Event Tracing Module Records pertinent detailed metrics per Charm++ event. e.g. Start of an entry method invocation – details: source of the message size of the incoming message time of invocation chare object id One text line per event is written to the log file. One log file is maintained per processor.
The Projections Summary Profile Module Entry Method Execution 50% 100% 100% 100% 50% 0 t 2t 3t 4t 5t 6t 7t 8t When Application encounters an event after 8t 75% 100% 75% 0 2t 4t 6t 8t 10t 12t 14t 16t
TAU Profiles Like Projections’ Summary module, TAU profiles are direct-measurement profiles rather than statistical profiles. In the default case, for each entry method (and the main function), the following data is recorded: Total Inclusive Time Total Exclusive Time Number of Invocations
Tutorial Outline General Introduction Instrumentation Trace Generation Support for TAU profiles Performance Analysis Dealing with Scalability and Data Volume
Getting TAU Profiles Requirements: Get and install the TAU package from: http://www.cs.uoregon.edu/research/tau/downloads.php Building TAU support into Charm++: ./build Tau <charm_build> – tau-makefile=<tau_install_dir>/ <arch>/lib/<name of tau makefile> � e.g. “ ./build Tau mpi-crayxt – tau-makefile=/home/me/tau/ craycnl/lib/Makefile.tau-mpi ”
Tutorial Outline General Introduction Instrumentation Trace Generation Support for TAU profiles Performance Analysis Dealing with Scalability and Data Volume
Performance Analysis Live demo with the simple object-imbalance code as an example. We will see: Building the code with tracemodes “projections”, “summary” and “Tau”. Executing the code and generating logs on a local 8-core machine with some control options. Visualizing the resulting performance data with Projections and paraprof (for TAU data). Repeating the above process with different experiments.
The Load Imbalance Example • 4 objects assigned to each processor. Obj 3 • Objects on even processors get 2 units of work. Obj 2 • Objects on odd processors get 1 unit of work. Obj 7 Obj 1 • Each object computes its Obj 6 assigned work each iteration. Obj 5 • Each iteration is followed Obj 0 Obj 4 by a barrier. PE 0 PE 1
The Load Imbalance Example (2) Iteration 0 Iteration 1 PE 0 PE 1 Barrier Barrier Passage of Time
Rebalancing the Load Iteration 0 Iteration 1 took 8 units of time now takes 6 units of time PE 0 PE 1 Load Balancing Barrier (eg. Greedy strategy) Passage of Time
Using Projections on The Load Imbalance Example Executed on 8 processors (single 8-core chip). Charm++ program run over 10 iterations with Load Balancing attempted at iteration 5. Experiments: Experiment 1: No Load Balancing attempted (DummyLB). Experiment 2: Greedy Load Balancing attempted. Experiment 3: Make only object 0 do an insane amount of work and repeat 1 & 2.
Tutorial Outline General Introduction Instrumentation Trace Generation Support for TAU profiles Performance Analysis Dealing with Scalability and Data Volume
Scalability and Data Volume Control Pre-release or beta features. How do we handle event trace logs from thousands of processors? What options do we have for limiting the volume of data generated? How do we avoid getting lost trying to find performance problems when looking at visual displays from extremely large log sets?
Limiting Data Volume Careful use of traceBegin()/traceEnd() calls to limit instrumentation to a representative portion of a run. Eg. In NAMD benchmarks, we often look at 100 steps after the first major load balancing phase, followed by a refinement load balancing phase, followed by another 100 steps.
Limiting Data Volume (2) Pre-release feature – writing only a subset of processors’ performance data to disk. Uses clustering to identify equivalence classes of processor behavior. This is done after the application is done, but before performance data is written to disk. Select “exemplar” processors from each equivalence class. Select “outlier” processors from each equivalence class. These processors will represent the run. Write the performance data of representative processors to disk. Projections is able to handle the partial datasets when visualizing the information.
Visualizing Large Datasets Usage Profile: Only 64 processors. What about thousands? Projections Outlier Analysis Tool: Sorted by “deviancy”
Automatic Analysis Support Outlier Analysis (previous slide) Noise Miner
Recommend
More recommend
Explore More Topics
Stay informed with curated content and fresh updates.
