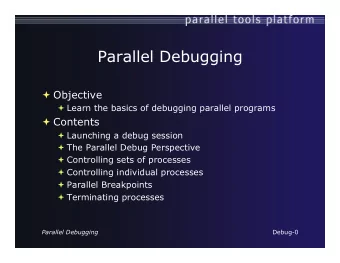
Parallel Debugging Bettina Krammer, Matthias Mller, Pavel Neytchev, - PowerPoint PPT Presentation
Parallel Debugging Bettina Krammer, Matthias Mller, Pavel Neytchev, Rainer Keller University of Stuttgart High-Performance Computing-Center Stuttgart (HLRS) www.hlrs.de Parallel Debugging r Hchstleistungsrechenzentrum Stuttgart Outline
Parallel Debugging Bettina Krammer, Matthias Müller, Pavel Neytchev, Rainer Keller University of Stuttgart High-Performance Computing-Center Stuttgart (HLRS) www.hlrs.de Parallel Debugging r Höchstleistungsrechenzentrum Stuttgart
Outline • Motivation • Tools and Techniques • Common Programming Errors – Portability issues • Approaches and Tools – Memory Tracing Tools • Valgrind – Debuggers • DDT – MPI-Analysis Tools • Marmot • Examples • Conclusion Parallel Debugging Slide 2 Höchstleistungsrechenzentrum Stuttgart
Motivation Parallel Debugging Slide 3 Höchstleistungsrechenzentrum Stuttgart
Motivation - Problems of Parallel Programming I • All problems of serial programming – For example, use of non-initialized variables, typos, etc. – Is your code portable? • portable C/C++/Fortran code? • 32Bit/64Bit architectures – Compilers, libraries etc. might be buggy themselves – Legacy code - a pain in the neck Parallel Debugging Slide 4 Höchstleistungsrechenzentrum Stuttgart
Motivation - Problems of Parallel Programming II • Additional problems: – Increased difficulty to verify correctness of program – Increased difficulty to debug N parallel processes – New parallel problems: • deadlocks • race conditions • Irreproducibility • Errors may not be reproducible but occur only sometimes Parallel Debugging Slide 5 Höchstleistungsrechenzentrum Stuttgart
Motivation - Problems of Parallel Programming III • Typical problems with newly parallelized programs: the program – does not start – ends abnormally – deadlocks – gives wrong results Parallel Debugging Slide 6 Höchstleistungsrechenzentrum Stuttgart
Tools & Techniques Parallel Debugging Slide 7 Höchstleistungsrechenzentrum Stuttgart
Tools and Techniques to Avoid and Remove Bugs • Programming techniques • Static Code analysis – Compiler (with –Wall flag or similar), lint • Post mortem analysis – Debuggers • Runtime analysis – Memory tracing tools – Special OpenMP tools (assure, thread checker) – Special MPI tools (e.g MARMOT, MPI-Check) Parallel Debugging Slide 8 Höchstleistungsrechenzentrum Stuttgart
Programming Techniques I – Portability issues • Make your program portable – Portability guides for C, C++, Fortran, MPI programs – Test your program with different compilers, MPI libraries, etc., on different platforms • architectures/platforms have a short life • all compilers and libraries have bugs • all languages and standards include implementation defined behavior – running on different platforms and architectures significantly increases the reliability • Make your serial program portable before you parallelize it Parallel Debugging Slide 9 Höchstleistungsrechenzentrum Stuttgart
Programming Techniques II • Start with simple constructs (basic MPI calls: init, finalize, comm_rank, comm_size, send, recv, isend, irecv, wait, bcast,…) before you use fancier constructs (waitany,…) • Use verification tools for parallel programming like assure • Think about a verbose execution mode of your program • Use a careful/paranoid programming style – check invariants and pre-requisites (assert(m>=0), assert(v<c) ) Parallel Debugging Slide 10 Höchstleistungsrechenzentrum Stuttgart
Programming Techniques III • Comment your code – Do not comment obvious things – Comment and describe algorithms and your decisions if there are several options, caveats, etc. – Keep documentation up-to-date (installation, user and developer guides) – Use tools like doxygen for automatically generated documentation (html, latex,…) • Coding conventions Parallel Debugging Slide 11 Höchstleistungsrechenzentrum Stuttgart
Static Code Analysis – Compiler Flags • Use the debugging/assertion techniques of the compiler – use debug flags (-g), warnings (-Wall) • Different compilers may give you different warnings – array bound checks in Fortran – use memory debug libraries (-lefence) Parallel Debugging Slide 12 Höchstleistungsrechenzentrum Stuttgart
What is a Debugger? • Common Misconception: A debugger is a tool to find and remove bugs • A debugger does: – tell you where the program crashed – help to gain a better understanding of the program and what is going on • Consequence: – A debugger does not help much if your program does not crash, e.g. just gives wrong results – Use it as last resort. Parallel Debugging Slide 13 Höchstleistungsrechenzentrum Stuttgart
Common MPI Programming Errors Parallel Debugging Slide 14 Höchstleistungsrechenzentrum Stuttgart
Common MPI programming errors I – Collective Routines • Argument mismatches (e.g. different send/recv- counts in Gather) • Deadlocks: not all processes call the same collective routine – E.g. all procs call Gather, except for one that calls Allgather – E.g. all procs call Bcast, except for one that calls Send before Bcast, matching Recv is called after Bcast – E.g. all procs call Bcast, then Gather, except for one that calls Gather first and then Bcast Parallel Debugging Slide 15 Höchstleistungsrechenzentrum Stuttgart
Common MPI programming errors II – Point-to-Point Routines • Deadlocks: matching routine is not called, e.g. Proc0: MPI_Send(…) MPI_Recv(..) Proc1: MPI_Send(…) MPI_Recv(…) • Argument mismatches – different datatypes in Send/Recv pairs, e.g. Proc0: MPI_Send(1, MPI_INT) Proc1: MPI_Recv(8, MPI_BYTE) Illegal! Parallel Debugging Slide 16 Höchstleistungsrechenzentrum Stuttgart
Common MPI programming errors III – Point-to-Point Routines – especially tricky with user-defined datatypes, e.g. MPI_INT MPI_DOUBLE derived datatype 1: DER_1 derived datatype 2: DER_2 derived datatype 3: DER_3 MPI_Send ( 2, DER_1), MPI_Recv(1, DER_2) is legal MPI_Send(2, DER_1), MPI_Recv(1, DER_3) is illegal – different counts in Send/Recv pairs are allowed as Partial Receive MPI_Send(1, DER_1), MPI_Recv(1, DER_2) is legal MPI_Send(1, DER_1), MPI_Recv(1, DER_3) is legal MPI_Send(1, DER_2), MPI_Recv(1, DER_1) is illegal Parallel Debugging Slide 17 Höchstleistungsrechenzentrum Stuttgart
Common MPI programming errors IV – Point-to-Point Routines – Incorrect resource handling • Non-blocking calls (e.g. Isend, Irecv) can complete without issuing test/wait call, BUT: Number of available request handles is limited (and implementation defined) • Free request handles before you reuse them (either with wait/successful test routine or MPI_Request_free) Parallel Debugging Slide 18 Höchstleistungsrechenzentrum Stuttgart
Common MPI programming errors V – Others • Incorrect resource handling – Incorrect creation or usage of resources such as communicators, datatypes, groups, etc. – Reusing an active request – Passing wrong number and/or types of parameters to MPI calls (often detected by compiler) • Memory and other resource exhaustion – Read/write from/into buffer that is still in use, e.g. by an unfinished Send/Recv operation – Allocated communicators, derived datatypes, request handles, etc. were not freed • Outstanding messages at Finalize • MPI-standard 2: I/O errors etc. Parallel Debugging Slide 19 Höchstleistungsrechenzentrum Stuttgart
Common MPI programming errors VI – Race conditions • Irreproducibility – Results may sometimes be wrong – Deadlocks may occur sometimes • Possible reasons: – Use of wild cards (MPI_ANY_TAG, MPI_ANY_SOURCE) – Use of random numbers etc. – Nodes do not behave exactly the same (background load, …) – No synchronization of processes • Bugs can be very nasty to track down in this case! • Bugs may never occur in the presence of a tool (so-called Heisenbugs ) Parallel Debugging Slide 20 Höchstleistungsrechenzentrum Stuttgart
Common MPI programming errors VII – Portability issues • MPI standard leaves some decisions to implementors, portability therefore not guaranteed! – “Opaque objects” (e.g. MPI groups, datatypes, communicators) are defined by implementation and are accessible via handles. • For example, in mpich, MPI_Comm is an int • In lam-mpi, MPI_Comm is a pointer to a struct – Message buffering implementation-dependent (e.g. for Send/Recv operations) • Use Isend/Irecv • Bsend (usually slow, beware of buffer overflows) – Synchronizing collective calls implementation-dependent – Thread safety not guaranteed Parallel Debugging Slide 21 Höchstleistungsrechenzentrum Stuttgart
Approaches & Tools Parallel Debugging Slide 22 Höchstleistungsrechenzentrum Stuttgart
Valgrind – Debugging Tool Rainer Keller University of Stuttgart High-Performance Computing-Center Stuttgart (HLRS) http://www.hlrs.de Parallel Debugging r Höchstleistungsrechenzentrum Stuttgart
Valgrind – Overview • An Open-Source Debugging & Profiling tool. • Works with any dynamically linked application. • See previous presentation • More information: http://www.hlrs.de/people/keller/mpich_valgrind.html Parallel Debugging Slide 24 Höchstleistungsrechenzentrum Stuttgart
Parallel Debuggers Parallel Debugging r Höchstleistungsrechenzentrum Stuttgart
Recommend
More recommend
Explore More Topics
Stay informed with curated content and fresh updates.
