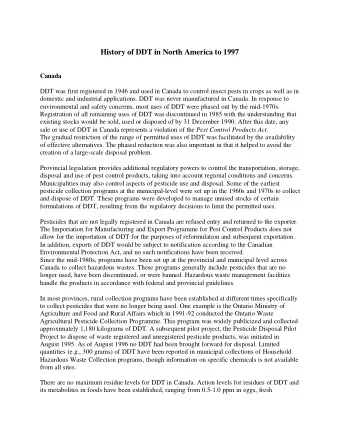
Petascale Debugging with Allinea DDT David Lecomber - PowerPoint PPT Presentation
Petascale Debugging with Allinea DDT David Lecomber david@allinea.com CTO www.allinea.com Interesting Times ... Processor counts Systems in Top 500 growing rapidly 80 70 GPUs entering HPC 60 50 8k - 32k cores Large hybrid
Petascale Debugging with Allinea DDT David Lecomber david@allinea.com CTO www.allinea.com
Interesting Times ... • Processor counts Systems in Top 500 growing rapidly 80 70 • GPUs entering HPC 60 50 8k - 32k cores • Large hybrid systems 32k+ cores 40 imminent 30 20 • But what happens when 10 software doesn't work? 0 2006 2006 2007 2007 2008 2008 2009 2009 Year (June & November Lists) www.allinea.com
Why the graph? • Debuggability Systems in Top 500 – A subjective measure of 80 the ability to be debugged 70 • Linear tool architectures 60 – Linear (or worse) 50 bottlenecks 8k - 32k cores 32k+ cores 40 – Pain threshold varies: 1 second, 1 minute, 1 hour? 30 • A major problem 20 – Previously exclusive to big 10 labs 0 2006 2006 2007 2007 2008 2008 2009 2009 – Now everyone is joining in Year (June & November Lists) the fun www.allinea.com
Approaches to Scale • Ignore the problem – Pretend bugs at scale do not happen • Best programming practices – Consistency checking and self-diagnosis within code – Still frustrated by some types of bug • Lightweight debugging – STAT (LLNL) identifies equivalent processes using stacks – STAT calls DDT (or TTV) to debug representatives – Other work is promising • But what about full-strength debuggers? www.allinea.com
Full-strength Debugging • Many benefits to graphical parallel debuggers – Large feature sets for common bugs – Richness of user interface and real control of processes • Historically all parallel debuggers hit scale problems – Bottleneck at the frontend: Direct GUI → nodes architectures • Linear performance in number of processes – Human factors limit – mouse fatigue and brain overload • Are tools ready for the task? – DDT has changed the game www.allinea.com
DDT in a nutshell • Scalar features – Advanced C++ and STL – Fortran 90, 95 and 2003: modules, allocatable data, pointers, derived types – Memory debugging • Multithreading & OpenMP features – Step, breakpoint etc. one or all threads • MPI features – Easy to manage groups – Control processes by groups – Compare data – Visualize message queues www.allinea.com
Memory Debugging • Find memory leaks • Or stop on read/write beyond end of array www.allinea.com
GPU Debugging • Run the code – Browse source – Set breakpoints – Stop at a line of CUDA code – Stops once for each scheduled collection of blocks • Select a CUDA thread – Examine variables and shared memory – Step a warp www.allinea.com
Scalable Process Control • Parallel Stack View – Finds rogue processes faster – Identifies classes of process behaviour – Allows rapid grouping of processes • Control Processes by Groups – Set breakpoints, step, play, stop etc. using user-defined groups – Mutates to scalable groups view – Compact group representations www.allinea.com
DDT: Petascale Debugging • DDT is delivering DDT 3.0 Performance Figures petascale debugging Jaguar XT5 today 0.16 0.14 – Collaboration with ORNL 0.12 on Jaguar Cray XT Time (Seconds) 0.1 All Step – Tree architecture – 0.08 All Breakpoint 0.06 logarithmic performance 0.04 – Many operations now 0.02 faster at 220,000 than 0 0 50,000 100,000 150,000 200,000 previously at 1,000 cores MPI Processes – ~1/10 th of a second to step and gather all stacks at 220,000 cores www.allinea.com
Presenting Data, Usefully • Gather from every node – Potentially costly – if all data different – Easy if data mostly same – New ideas • Aggregated statistics • Probabilistic algorithms optimize performance – even in pathological case • Watch this space! – With a fast and scalable architecture, new things become possible www.allinea.com
Data Gathering Results • Benchmarked on five Gather Data and Stacks codes on Jaguar XT 0.14 0.12 – Stacks gathering mileage can vary: default install at 0.1 ORNL has full debug info 0.08 deep into MPI Time (seconds) 0.06 – Cross Process Comparison 0.04 • Of equal variable 0.02 • Of MPI rank (a bad case!) 0 0 20000 40000 60000 80000 100000 120000 140000 Stacks CPC – Same MPI Processes CPC – Dif- ferent www.allinea.com
The DDT Tree, In Brief • Depth/width – Another gut feel pseudo calculation story ;-) – Override by environment variables • Start up – Use vendor's fast transfer of topology file and daemons, where present – Each daemon connects to its parent • Message aggregation/broadcast – Commands targeted to process sets, tree sends to intersect with children – Responses merged – but doesn't wait too long! – Ordered sets of process ranges www.allinea.com
Current Status • Most features now scale – Attach, run, process control and breakpoints – Process stacks – Data comparison – Memory debugging – out-of-bound array access, leaks, etc. – Import/export – stacks (XML/CSV), arrays, compared data – T ested at 220k cores on XT; 8k on Blue Gene P (SMP mode) – more timings soon; Ranger (Linux IB cluster) – New distributed array features – New grow/shrink attached-set - in addition to existing subset capabilities www.allinea.com
Experience at 220k.. • Lessons learnt – The scalable tree has really delivered! • More optimizations still possible – Even if you're quick, it's still all about the GUI • Present sensibly to the user – parallel stacks, data comparison • ... but some machines don't encourage full power of debugging due to their architecture – MPI spec probably never meant debuggers to scale! • Still linear things in there.. eg. MPIR_proctable – It's hard to debug a debugger without a debugger www.allinea.com
Limits of the approach • Logarithmic performance should last for many years – Any linear factors will eventually dominate • Must eradicate them all over time • Any memory usage on per-process basis – More intelligence can be pushed down the tree as need arises – Predict core operations on 1M or 10M cores will be under the pain threshold – SIMD/almost-SIMD GPUs fit within current approach (as threads, not individual processes) • ... but bugs can still be hard to find www.allinea.com
Mind The Gap(s) • Collaboration opportunity – No single organization has the resources to do everything • Plenty of opportunity for everyone in debugging • We use tools independently – but using together is more compelling – Examples: • MPI correctness checking – Marmot, Intel MPI Checker • Library specific sanity checkers for data • Comparative debugging – Ideal scenario: easy to prototype new bug finding ideas • Not tied to a particular product – but tied to an open API/scripting language • Single process or built from the top (drive a full debugger, or eg. combination of Wisconsin tools) www.allinea.com
Questions? www.allinea.com
Recommend
More recommend
Explore More Topics
Stay informed with curated content and fresh updates.
