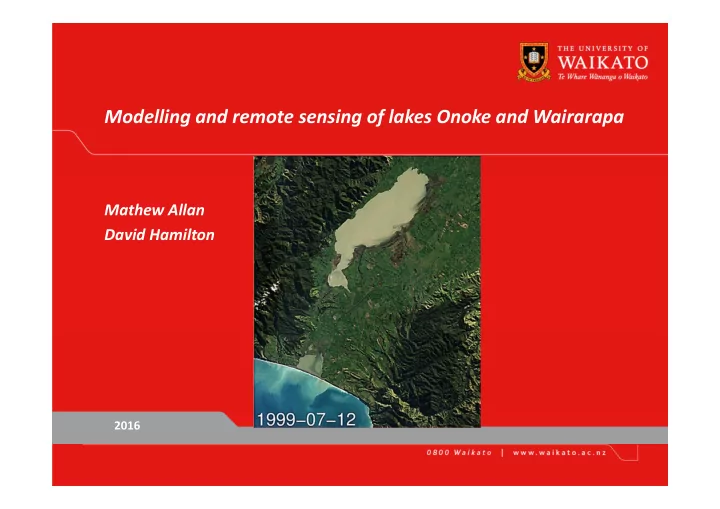

Modelling and remote sensing of lakes Onoke and Wairarapa Mathew Allan David Hamilton 2016
Introduction Approaches to assess water quality • In situ sampling, numerical modelling and remote sensing • In situ sampling lacks the ability to effectively monitor the spatial variability • Three ‐ dimensional (3 ‐ D) and one ‐ dimensional (1 ‐ D) hydrodynamic modelling of lake water quality and temperature: – interpolate temporal gaps in data derived from satellite and traditional monitoring – extend the analysis to the vertical domain – provide insights into the spatial variability of biogeochemical processes
Method: 3 ‐ D Numerical Hydrodynamic Model The Estuary and Lake Computer Model (ELCOM) CWR Australia Hydrodynamic and thermodynamic models in order to predict velocity, salinity and temperature in waterbodies
3 ‐ D model 4
5
1 ‐ D model 6
Modelling ‐ future work • Calibration/validation of 1D and 3 ‐ D models using in situ water quality data measured by the Greater Wellington Regional Council and remote sensing data • Calibrated models will then be used to determine the likely water quality and ecological effects of specific management scenarios 7
Remote sensing data United States Geological Survey (USGS) on demand atmospherically corrected Landsat imagery ordered from http://espa.cr.usgs.gov/index/, including 91 images 8
9 Image source: NASA
Remote sensing semi ‐ analytical model CDOM Absorption Absorption Image: Craig Williamson Image: NASA ISS Image: NASA 10
Remote sensing results 300.000 In situ TSS = 1.04 Landsat TSS ‐ 3.60 250.000 R² = 0.97 In situ TSS (mg L ‐ 1 ) 200.000 150.000 100.000 50.000 0.000 0.000 50.000 100.000 150.000 200.000 250.000 Landsat TSS (mg L ‐ 1 ) Comparison of in situ TSS to Landsat estimated TSS (mg L ‐ 1 ) using a semi ‐ analytical relationship r 2 of 0.97, RMSE 16.62 mg L ‐ 1 32% RMSE over a range of in situ TSS from 3 ‐ 239 mg L ‐ 1 . 11
Landsat estimated total suspended solids 12
Landsat estimated total suspended solids 13
Acknowledgements • Greater Wellington Regional Council staff • Ruam ā hanga Whaitua Committee • Chris McBride (UOW)
Modelled subsurface reflectance ( R (0-)) for varying chlorophyll a concentrations ranging from 0 to 450 µ g L -1 with fixed CDOM absorption of 0.16 m -1 and tripton concentration of 0.5 mg L -1 . The relative spectral response of Landsat bands B1, B2 and B3 is overlaid.
CDOM TSS – non ‐ living
2 r rs ( ) = g u ( ) g u ( ) 0 1 Equations RS b ( ) b u ( ) = a ( ) b ( ) b • • and go and g1 are empirical constants that depend on the anisotropy of the downwelling light field and scattering processes within the water. The • constant go is equivalent to f/Q where f represents geometrical light factors and Q represents the light distribution factor, which is defined as upwelling subsurface irradiance/upwelling subsurface radiance) (Maritorena et al. 2002). It has been suggested that go and g1 should be considered as variables in optically complex inland waters (Aurin and Dierssen 2012; Li et al. 2013) therefore we used fitted values for go and g1 of 0.103 and 0.009 respectively, which were derived previously for Lake Ellesmere (Allan, 2014). The absorption and backscattering coefficients are comprised of individual optically active constituents: • bb( λ ) = bbw( λ ) + BbTSS b*TSS( λ ) CTSS • a( λ ) = aw( λ ) + C ϕ a* ϕ ( λ ) + aCDOMD( λ ) • aCDOMD( λ ) = aCDOMD( λ 440) exp[ ‐ S ( λ ‐ λ 440)] • where: • bbw( λ ) = backscattering coefficient of water • BpTSS = backscattering ratio from TSS • b*TSS( λ ) = specific scattering coefficient of TSS • CTSS = concentration of TSS • b* ϕ ( λ ) = specific scattering coefficient of phytoplankton • aw( λ ) = absorption coefficient of pure water • C ϕ = concentration of chl a • a* ϕ ( λ ) = specific absorption coefficient of phytoplankton • aCDOMD( λ ) = absorption coefficient for coloured dissolved organic matter (CDOM) • S = spectral slope coefficient • Values of aw( λ ) and bbw( λ ) were prescribed from the literature (Morel 1974; Pope and Fry 1997). The backscattering ratio of TSS, BpTSS , was set to • 0.019 (Petzold 1972). The specific scattering coefficient of TSS at the Landsat b3 wavelength was estimated using a power function (Morel and Prieur 1977) where the value b*TSS (555) was set to 0.6 m2 g ‐ 1. The hyperbolic exponent n was set to 0.63, equating to a value measured in Lake Taupo, New Zealand (Belzile et al. 2004). The a* ϕ (662) was 0.0136 m2 mg ‐ 1 , equal to the average value measured in eight Dutch lakes (Dekker et al., 2002). The bio ‐ optical simulations were run by varying TSS concentration from 0.1 to 417.6 mg L ‐ 1 in increments of 0.5 mg L ‐ 1 while aCDOMD(440) was fixed at 0.042 m ‐ 1, which is average in situ of measurement in Lakes Wairarapa and Onoke, with chl a (µg L ‐ 1) taken to increase with TSS (chl a= TSS/6) ranging from 0.017 to 67.6 µg L ‐ 1 (encompassing a similar range to that measured in situ in Lakes Onoke and Wairarapa). 18
Recommend
More recommend