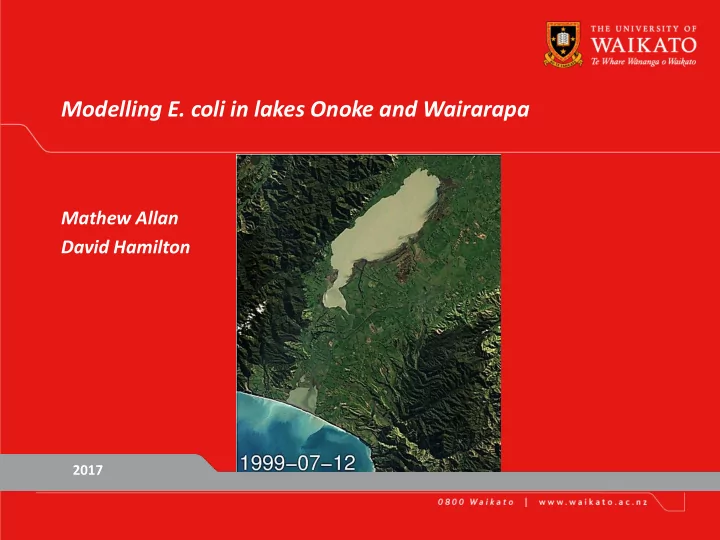

Modelling E. coli in lakes Onoke and Wairarapa Mathew Allan David Hamilton 2017
Method: 3-D Numerical Hydrodynamic Model Hydrodynamic and thermodynamic models in order to predict velocity, salinity and temperature in waterbodies 1D 3D
1-D vs. 3-D • Models should be no more complicated than necessary to provide the needed information with acceptable accuracy (Bower et al. 1977) • Large spatial variation of water quality in lakes Onoke and Wairarapa • 3-D modelling better represents scenarios that change the spatial variation 3
Reporting points – Lake Onoke
Reporting points – Lake Wairarapa 5
Scenarios – Lake specific Lake specific modelling scenarios were run in addition to catchment scenarios. The Lake Wairarapa specific Description scenarios included: Modelling shorthand naming conventions ALL_RUA_SILVER2025/2040/2080 All flows of the Ruamāhanga River entering Lake ALL_RUA GOLD2025/2040/2080 Wairarapa. No flow by-passing via the diversion. MEDIAN_RUA_SILVER2025/2040/2080 Flows below median flow go into Lake Wairarapa, and flows above median flow are by-passed Outlet_Close_SILVER2025/2040/2080, Lake Onoke outlet closed January to March every year. Outlet_Close_Rua_All_SILVER2025/2040/2080 Lake Onoke outlet closed Jan to Mar, all Ruamahanga flows diverted into Lake Wairarrapa before entering Onoke 1m_Inc_SILVER2025/2040/2080 Deepening both lakes by 1m 6
Catchment nutrient load reduction Wai Onoke 0 0 Baseline BAU2080 SILVER2080 GOLD2080 Baseline BAU2080 SILVER2080 GOLD2080 -5 -5 -10 -10 -15 -15 -20 -20 -25 -25 -30 -30 -35 -35 -40 -40 -45 -45 -50 -50 TP external load (%) TN external load (%) TN external load (%) TN external load (%) 7
Wairarapa Onoke 1-D outputs Silver + Onoke Silver + non- Silver + all flows Modelling outlet closed + flood flows of Modelling SILVER + 1 m Silver + Onoke of Ruamāhanga Lake Wairarapa dataNo NOF BAU SILVER GOLD all flows of Ruamāhanga dataNOF band deth outlet closed into Lake band Ruamāhanga into Lake Wairarapa into Lake Wairarapa E. coli Phytoplankton C C B B C B B Total nitrogen B B B B B C B Total phosphorus D D D D D D D Trophic Level Index -TLI 5.6 5.5 5.3 5.3 5.2 5.2 5.1 Total suspended sediment 65 64 63 63 46 60 58 Ammonia toxicity A A A A A A A Cyanobacteria (planktonic) A A A A A A A Macrophytes (% cover) 0.027 3.93E-08 11 11 44 17 1.40E-05 Lake Onoke E. coli Phytoplankton C C B B C B B Total nitrogen B B B B B B B Total phosphorus D D C C C C C TLI 5.4 5.2 5.0 5.0 4.9 4.8 5.0 Total suspended sediment 32 31 30 30 23 22 33 Ammonia toxicity A A A A A A A Cyanobacteria (planktonic) A A A A A A A Macrophytes (% cover) 0.030 0.0321501 0.0321057 0.032106 0.0373972 0.00646906 0.0128636 8
3-D simulation results – TSS Lake Wairarapa Baseline BAU2080 SILVER2080 Median Ruamahanga SILVER2080 1m lake level rise diversion SILVER2080 Ruamahanga diversion SILVER2080
3-D simulation results – chl a Lake Wairarapa Baseline BAU2080 SILVER2080 Median Ruamahanga SILVER2080 1m lake level rise diversion SILVER2080 Ruamahanga diversion SILVER2080
3-D simulation results – TSS Lake Onoke Baseline BAU2080 SILVER2080 SILVER2080 1m increase SILVER2080 outlet closed SILVER2080 outlet closed Rua. diversion
3-D simulation results – chl a Lake Onoke Baseline BAU2080 SILVER2080 SILVER2080 1m increase SILVER2080 outlet closed SILVER2080 outlet closed Rua. diversion
3-D outputs – Middle site Silver + Onoke Silver + non-flood Silver + all flows of Silver + 1m Silver + Onoke Modelling data outlet closed + all flows of Attribute BAU Silver Gold Ruamāhanga into additional depth outlet closed No NOF NOF flows of Ruamāhanga into Lake Wairarapa band band Ruamāhanga into Lake Wairarapa Lake Wairarapa Middle Phytoplankton C − C − C − C ↓ D ↓ D − C Total nitrogen B − B − B − B − B − B − B Total phosphorus D − D − D − D ↑ C − D ↑ C Trophic Level Index -TLI 5.49 − 5.49 − 5.31 − 5.32 − 5.17 − 5.56 − 5.24 Total suspended sediment 71 1418 70 1417 70 1429 71 344 21 1357 68 1481 73 Ammonia toxicity A − A − A − A − A − A − A Lake Onoke Middle Phytoplankton B ↓ C − B − B ↓ C ↑ A ↓ C Total nitrogen C ↑ B ↑ B ↑ B ↑ B ↑ B − C Total phosphorus B − B − B − B − B ↑ A − B TLI 4.64 − 4.63 − 4.45 − 4.45 − 4.51 ↑ 3.98 − 5.00 Total suspended sediment 59 -30 41 -36 37 -36 38 -65 21 -9 53 56 92 Ammonia toxicity A − A − A − A − A − A − A 13
Summary • SILVER2080 and GOLD2080 catchment scenarios were not significantly different • High internal loading of phosphorous from sediments in Lake Wairarapa results in reduction of effectiveness of mitigations compared to Lake Onoke • Diversion scenarios can potentially increase chl a concentrations • Below median Ruamāhanga diversion scenarios only estimated a small increase in chl a - this may not be significant • Below median Ruamāhanga divisions reduce trophic state more than SILVER2080 alone in Lake Wairarapa 14
• Reducing external load + water levels increased = macrophyte re- establishment presents the best opportunity for water quality improvement in Lake Wairarapa • Lake Onoke outlet closed reduced chl a (under non-division) concentrations, but this is due to higher TSS concentrations and higher light limitation • Longer simulation periods needed for 3-D models to enable NOF estimation 15
Acknowledgements • Greater Wellington Regional Council staff • Ruamāhanga Whaitua Committee • Chris McBride (UOW)
Recommend
More recommend