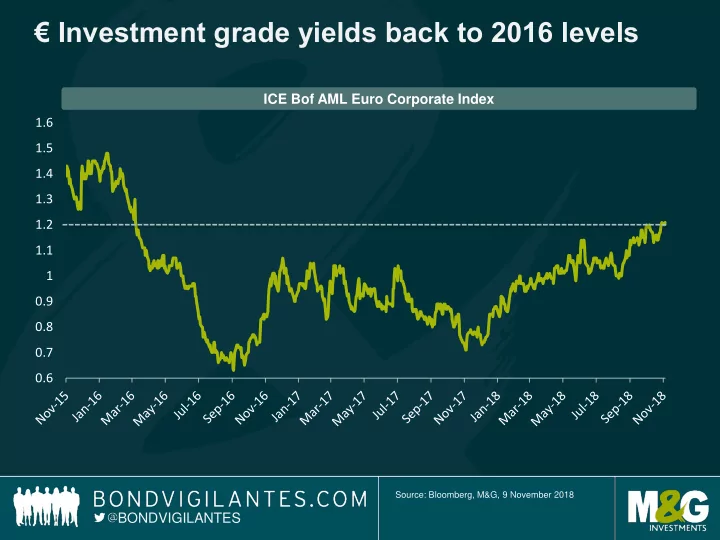

€ Investment grade yields back to 2016 levels ICE Bof AML Euro Corporate Index 1.6 1.5 1.4 1.3 1.2 1.1 1 0.9 0.8 0.7 0.6 Source: Bloomberg, M&G, 9 November 2018 BONDVIGILANTES
US high yield valuations have adjusted as of late High yield spreads widen from October saw yields hit 7% for first time post-crisis tights since 2016 420 US high yield credit spread (bps) 7.2% 400 7.0% US HY yield to maturity 351 bps 380 6.8% 6.6% 360 6.4% 340 6.2% 320 6.0% 300 5.8% Source: Bloomberg, Bank of America Merrill Lynch US High Yield Index, 31 October 2018 BONDVIGILANTES
The US is more advanced in the credit cycle, but HY balance sheets look healthy LEVERAGE INTEREST COVERAGE Net leverage multiple* 5.0 7.5 Interest coverage multiple** 6.5 4.0 5.5 3.0 4.5 2.0 3.5 2.5 1.0 US HY net leverage US HY interest coverage US HY ex commodities net leverage US HY coverage ex commodities US high yield leverage continues to dip with interest cover around the highs Source: Bank of America Merrill Lynch Global Research, 30 June 2018. *Net Debt/LTM EBITDA. **LTM EBITDA/Net LTM interest expense BONDVIGILANTES
The US HY market sees a decrease in supply Gross high yield issuance is So is net issuance down 300 80 Net US HY cumulative Issuance in Gross US HY cumulative Issuance 60 250 40 200 20 in USD billions USD billions 0 150 -20 100 -40 50 -60 -80 0 2013 2014 2015 2013 2014 2015 2016 2017 2018 2016 2017 2018 Source: Bank of America Merrill Lynch, 31 October 2018 BONDVIGILANTES
The week ahead Tuesday: Japan GDP (3Q) Wednesday: October US CPI September Industrial Production in Japan Thursday: October US Retail sales Friday : October Eurozone CPI Source: Bloomberg as of 9 November 2018. B O N D V I G I L A N T E S
Recommend
More recommend