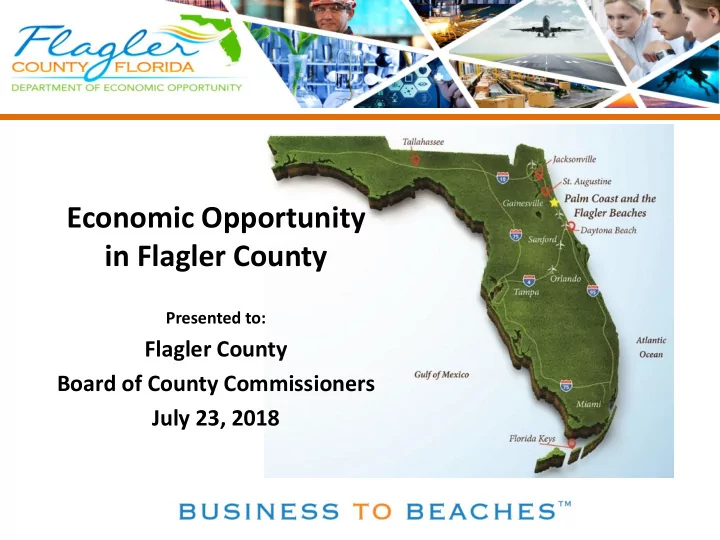

Economic Opportunity in Flagler County Presented to: Flagler County Board of County Commissioners July 23, 2018
Who We Are 430 Skilled Employees 200,000 sf Industrial Space • Communicating with Brunswick C-suite • Created website for employers to post relevant positions and resources https://www.youcaninflaglercounty.com/employment-help • Collecting and posting employment opportunities on FlaglerCan app • Collaborating with partners to offer Job Fairs 50% • Connecting local businesses • 30% Contacting State, National and International partners re reuse of site 20% • Marketing site and workforce to investors/businesses
AGRICULTURE AVIATION/ AEROSPACE 6 % Five-Yr Projected Growth ENTREPRENEURSHIP CORPORATE SERVICES LOGISTICS / M 10% Five-Yr Projected Growth WHAT WE TARGET 222017 BOYETTE STRATEGIC ADVISORS REPORT HIGH TECHNOLOGY 6% Five-Yr Projected Growth LIFE SCIENCES 9% Five-Yr Projected Growth LOGISTICS & MANUFACTURING
Who We Are 2017 Recruitment Efforts By Company 61 Opportunities – only reflects ½ Year 5% 37 Proposals 10% 23 Prospects 25% 9 Projects 50% 7 50% 80% Imminent 30% 20% 100% 4
Who We Are 2017 Recruitment Efforts By Employment 6,980 Jobs (6 months) Opportunities 5% 2,937 Jobs Proposals 10% Prospects 1,280 Jobs 25% Projects 50% 256 Jobs Imminent 80% 50% 196 Jobs 30% 20% Announcement 100% 130
Who We Are Annual Employment Impact Summary 800 721 700 2017 600 437 Actual Jobs 721 Projected 500 437 *** Does not include temporary or construction jobs*** 400 328 300 239 159 200 50% 72 100 12 30% 20% 0 2012 2013 2014 2015 2016 2017 Projected Direct Indirect Induced
Who We Are Annual Wage Impact and 6Yr County Investment Projected Projected $30,167,421.28 $400K 2017 $ 2017 $23,567,420.80 2016 $400K 2016 $16,093,466.12 2015 2015 $10,899,224.35 $400K 2017 $23,567,420 Annual $400K 2014 2014 $6,476,481.83 Wages 2013 $400K 2013 $2,375,884.61 *** Does not include temporary or construction wages*** 2012 2012 $400K $378,478.59 $(5) $- $5 $10 $15 $20 $25 $30 $35 Millions Direct Indirect Induced Investment
Who We Are Annual Economic Output Impact Summary $160.00 $150,244,184 $140.00 2017 $77.6 Million Economic Output $120.00 $150 Million Projected $100.00 Millions *** Does not include capital investment, $77,613,000 $80.00 property taxes or rental agreements*** $ 58,871,490 $60.00 $40,974,105 $40.00 $27,828,765 50% $20.00 $8,563,727 30% 20% $873,558 $- 2012 2013 2014 2015 2016 2017 Projected Direct Indirect Induced
Who We Are 2017 Annual Annual Return Investment 50% 30% 20%
Who We Are Overall Return Overall Return Overall Investment
ADDITIONAL SERVICES • Business Hurricane Disaster Preparedness and Recovery • Brownfields Project Administration • Land Assemblage • Award-Winning Talent Recruitment Program • Annual Flagler County Career Fair • FlaglerCan! App • Business Concierge Services • Entrepreneurial Services/Partnerships • Import/Export Assistance – FTZ Designation • Agriculture Business Retention and Expansion • Manufacturing Business Retention and Expansion • Research Grant Assistance for local company growth • Marketing and Promotion (local, national & international) • Site Selector Series • State, Regional and Local Partnerships 50% • America Competitiveness Exchange Program “Be a yardstick of quality. • Florida High Tech Corridor Representative 30% Some people aren’t used to 20% • an environment where CareerSource Flagler-Volusia Board Member excellence is expected.” • Regional Representative to the Fl Econ. Dev. Council • Governor Appointee to the NEFl Regional Planning Assoc.
Who We Are 2016/2017 % Employment Growth 2.3% 2.6% 1.4% BOTTOM LINE
“We are growing our community in a sustainable fashion – one that provides careers and opportunity while enhancing our quality of life.” THANK YOU Helga van Eckert Executive Director hvaneckert@flaglercountyedc.com (386) 313-4071 Creative – Collaborative - Competitive Join us!
Recommend
More recommend