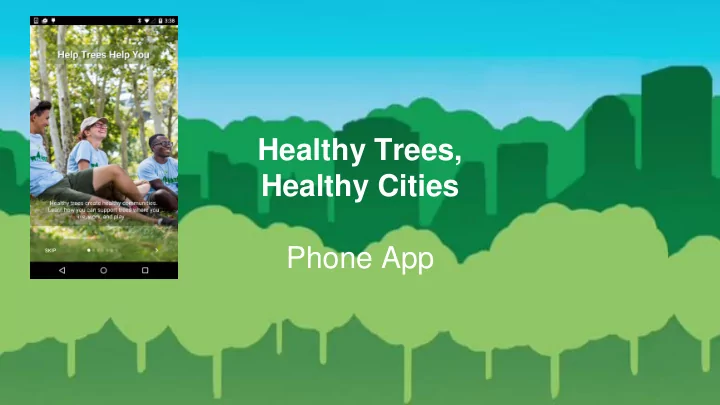

Healthy Trees, Healthy Cities Phone App
Healthy Trees, Healthy Cities Healthy Trees, Healthy Cities Creating a culture of stewardship that engages urban youth and community members in the planting, care, and stewardship of urban trees and forests to improve the health of people and their communities
Apple and Android App Stores “Healthy Trees Healthy Cities”
What does the app do? The HTHC app has 5 modules: 1. Tree Stewardship 2. Pruning 3. Tree Health Monitoring 4. Early Pest Detection 5. Tree Planting
What is the information used for? NATIONAL LOCAL PERSONAL
Summary New York Philadelphia Year Trees Plots Trees/plot Miles Surveyed Year Trees Plots Trees/plot Miles Surveyed 2015 3646 58 62.8 29 2015 2690 100 26.9 50 2016 2084 35 59.5 17.5 Washington, D.C. 2016: 7,000 Trees Surveyed w/ Casey Trees Most Common Species Most Common Species New York Philadelphia Species Found = 94 Species Found = 86 Species # Trees Species # Trees Honey Locust 902 London Plane Tree 343 London Plane Tree 634 Plum/Cherry 314 Callery Pear 389 Norway Maple 206 Ginkgo 347 Red Maple 191 Pin Oak 341 Honey Locust 133
Sample Design
Urban Tree Health Monitoring Non-Stressor Specific Evaluation of Tree Health Variable Notes Early Signs Discoloration Visual estimate Defoliation Visual estimate Transparency Digital estimate Dieback Visual estimate Later Signs Crown Vigor Visual estimate Tree Stress Index ത 𝑌 (𝑨 𝑤𝑗𝑝𝑠 + 𝑨 𝐸𝑓𝑔𝑝𝑚 + 𝑨 𝐸𝑗𝑓𝑐𝑏𝑑𝑙 + 𝑨 𝑈𝑠𝑏𝑜𝑡𝑞𝑏𝑠𝑓𝑜𝑑𝑧 + 𝑨 𝐸𝑗𝑡𝑑𝑝𝑚𝑝𝑠 ) Tree 36 Tree 71 Tree 45 Tree 75 Tree 65 Tree 77 Stress Index -0.783 Stress Index -.409 Stress Index -0.191 Stress Index -0.009 Stress Index 1.3 Stress Index 0.81
Red Maple in Philadelphia and New York Red Maple • Both cities show a similar range % of trees measured (n = 107) in tree stress for red maple street trees. (n = 191) • 20% of red maples in both cities have a stress index greater than 1.6. Stress Index Healthy Stressed
Fine Twig Dieback Honey locust London plane Red maple Most trees regardless of species have less than 30% % of trees measured fine twig dieback. 40% of red maples have no fine twig dieback while only 19% of honey locust have 0% fine twig dieback. % Fine Twig Dieback
Transparency Results from a healthy Discoloration red maple. Healthy Stressed Stress Index Dieback Defoliation
Transparency Results from a Discoloration stressed red maple. Healthy Stressed Stress Index Dieback Defoliation
Example: Detecting new tree health issues. 100% 90% 80% % of trees measured 70% London plane street trees (2015-2016). 60% 50% London plane street trees flooded during hurricane Sandy. Measured 2 years post 40% Sandy (2014). 30% 20% 10% 0% 0.0 0.5 1.0 1.5 2.0 2.5 3.0 3.5 4.0 4.5 Stress Index Healthy Stress Index Stressed
QUESTIONS
Thank You!
Recommend
More recommend