Gdb debugger Somewhat limited as a debugger, but works in a command - PowerPoint PPT Presentation
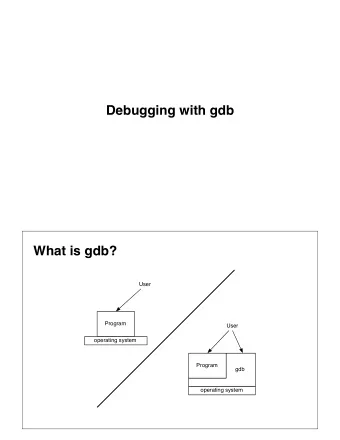
Gdb debugger Somewhat limited as a debugger, but works in a command line environment (so compatible with other stuff this term) Works for C/C++ programs Supports most core debugger features, well examine a few of the most common
Gdb debugger ● Somewhat limited as a debugger, but works in a command line environment (so compatible with other stuff this term) ● Works for C/C++ programs ● Supports most core debugger features, we’ll examine a few of the most common commands
Getting started ● When compiling the program, e.g. with g++, you must include the -g compiler option (include symbol table info in the .o/exe files) ● Start gdb for a specified executable, e.g. myprogx, using gdb ./myprogx ● Will spew a bunch of stuff about licensing and documentation then give command prompt that looks like (gdb)
Setting breakpoints ● Generally, we want to interrupt program at certain points (breakpoints) so we can look at what’s happening there ● At (gdb) prompt, we can set breakpoints, specifying either the name of a function or a line in the source code file, e.g. (gdb) break foo.cpp:23 (gdb) break foo.cpp:initialize ● Can clear breakpoints using, e.g. (gdb) clear foo.cpp:23
Running the program ● With our break points set, we can start program running and pass it command line arguments, e.g.: (gdb) run 10 foo 17.5 ● Program will run normally, prompting user for input etc normally, until either it ends or it encounters a breakpoint ● At breakpoints, it will pause, show you which line of code it has reached, and give a (gdb) prompt
Examining data ● When paused at a breakpoint, you can enter commands to examine variables, constants, or parameters that are in scope at that point in program by using print (p) command p somevariablename ● Can change variable value with set command set somevariable newvalue ● Can also examine (x) contents of a memory address x 12345678
Stepping forward through code ● At (gdb) prompt following a breakpoint, can tell program to step forward one instruction using next (n) or step (s), e.g. (gdb) n ● gdb will show you which instruction it goes on to, then breaks and gives another (gdb) prompt ● if the instruction processed is a function call, next treats the call as a single instruction and goes to next line in current function, but step goes “inside” the called function to continue stepping there
Resuming or quitting ● To resume “normal” running of the program (i.e. run until end or until next breakpoint) use continue (c) command (gdb) c ● To exit the debugger, use the quit command (gdb) quit
Examining the call stack ● To see the current active chain of function calls, use the backtrace command (gdb) backtrace ● Backtrace automatically runs if the program crashes, showing you which functions were active and which line of code was running at the point of crash
Lots of other functionality ● Each of the features we discussed has many other options ● Many other features we didn’t get to ● Learning a good debugger can make dev life a lot smoother, fortunately many (most?) IDEs have built in debugging functionality
Recommend
More recommend
Explore More Topics
Stay informed with curated content and fresh updates.
