Introduction to GDB Here We Start Crashes, errors and warnings are - PowerPoint PPT Presentation
Introduction to GDB Here We Start Crashes, errors and warnings are part of a C programmers life Debugger allows the programmer to take a look at the program in execution to deduce the cause of crashes and erroneous results Debugger
Introduction to GDB
Here We Start Crashes, errors and warnings are part of a C programmer’s life Debugger allows the programmer to take a look at the program in execution to deduce the cause of crashes and erroneous results
Debugger over naïve printf printf pollutes the code Difficult to probe the cause of a failure if printfs are absent at appropriate places Inserting a new code may change program behavior and therefore the nature and/or existance of error and/or crash Inserting new debug code implies recompilation
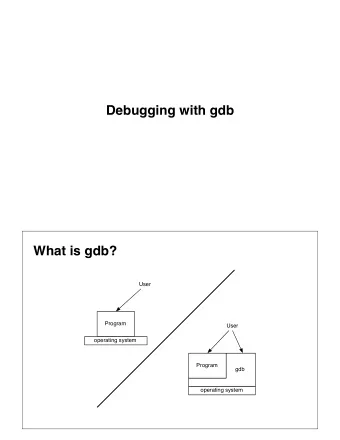
GDB GDB is the GNU Source-Level Debugger for C/C++ programs GDB may be used to debug programs that either crash or produce incorrect results when run Allows for debugging of single as well as multi-threaded programs
Compiling for Debugging Use “ -g ” or “ -ggdb ” compile option to add debugging information to the object files Preserves type information from variables Preserves function prototypes provides correspondence between instructions and source code line numbers A numerical argument may follow “ –g ” or “ –ggdb ”, 1 meaning least amount of debugging information and 3 maximum. Default is 2 With “ –g3 ” or “ -ggdb3 ”, preprocessor macros can be accessed
Running gdb Common ways to run GDB : gdb < executable> $ gdb hello Ex: gdb < executable> < core> $ gdb hello core.123 Ex: gdb < executable> < processid> Ex: $ gdb hello 123 Once program is loaded, run it: (gdb) r hello You can also specify arguments to the program: (gdb) r hello GNU
Debugger Features Stop program execution (breakpoints) Stop program execution under certain conditions (conditional breakpoints) Display values of variables, pointers, and contents of structures Execute program line by line Hop from stack frame to stack frame Create watchpoints Alter data and program execution
Breakpoints Specifies point in the program at which the debugger should stop executing (gdb) b main (gdb) b HelloWorld.c: 5 The above is useful in multifile projects (gdb) b printHelloWorld Each breakpoint gets an identifier which can be used later to enable, disable or delete the breakpoint
Stepping and Resuming Once a program has stopped at a specified point, it can be made to resume execution using one of the following ways: Execute next program line (after stopping); step over any function calls in the line (gdb) next Execute next program line (after stopping); step into any function calls in the line (gdb) step Continue running your program (after stopping, e.g. at a breakpoint) (gdb) c
Displaying variables Values of variables can be printed: (gdb) print num With display, variables are printed whenever they change (gdb) display num
Stack Frames Stack Frame: A structure which holds execution information for a function call Components of the structure are: - return pointer - space for the function’s return value (to be populated) - arguments to the function - local variables A stack frame is created for each function call and placed on the top of the stack When a function call returns, the frame corresponding to the function call is removed from the top of the stack
Navigating Stack Frames The commands to list the program stacks are: Display backtrace (that is the program stack upto the current point) (gdb) bt Move up the stack frame (gdb) up Move down the stack frame (gdb) down Display frame 1 (gdb) frame 1
Wrapping up To complete the function being currently executed, use “finish”. It also shows the value the function returned. (gdb) finish To quit gdb, use: (gdb) quit
Recommend
More recommend
Explore More Topics
Stay informed with curated content and fresh updates.
