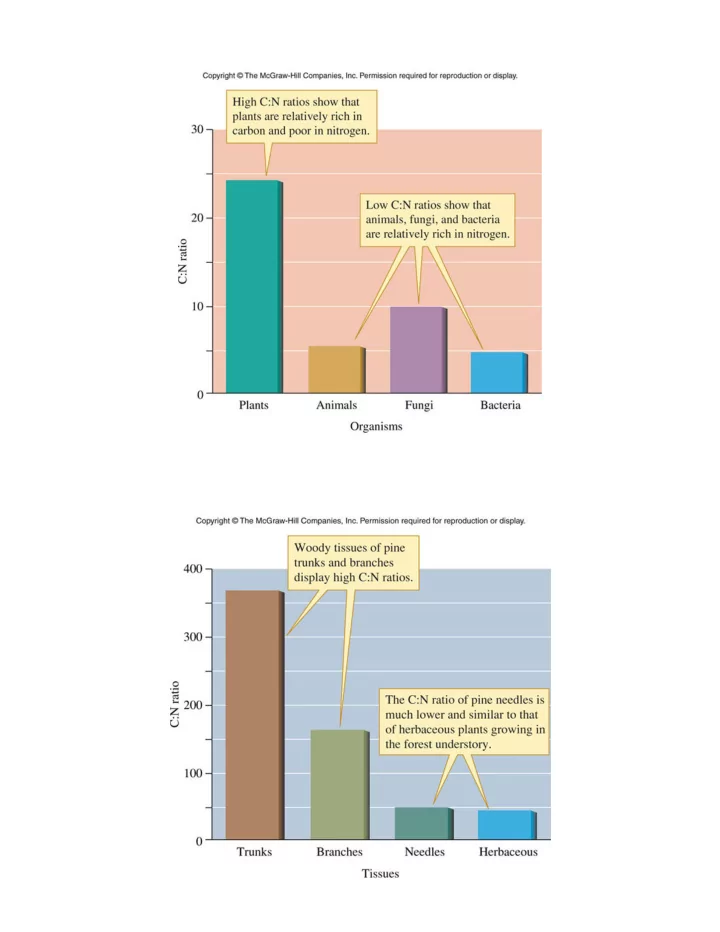

Figure 07_09 Figure 07_11
Sterner & Elser 2001 “Ecological Stoichiometry” organelles macromolecules N:P balance of different mammalian organs biotic components (where they keep N and P) (Elser et al. 1996)
H 375,000,000 O 132,000,000 C 85,700,000 N 6,430,000 Ca 1,500,000 P 1,020,000 S 206,000 Na 183,000 K 177,000 Cl 127,000 Mg 40,000 Si 38,600 Fe 2,680 Zn 2,110 Cu 76 I 14 Mn 13 F 13 Cr 7 Se 4 Mo 3 Co 1 ???????????? Heterotroph growth equation IN G = IN-(EG+EX) gut G = growth of the organism IN = ingestion rate organism EG = egestion rate (unassimilated) EX = excretion rate (metabolic waste) GGE=G/IN gross growth efficiency EX EG What about the stoichiometric quality of the food? Must take in C N P etc. in appropriate proportions…
Plants & Algae Unbalanced diet? Invertebrate herbivores Problem: C:N ratio of phloem sap is very high compared to the C:N of aphids. (nutritional imbalance) Solution: excrete excess C as “honeydew” which is sometimes collected by ants who guard aphid livestock. (maintain C:N homeostasis)
Plants are not just what they “eat.” Stoichiometric homeostasis? In a plant? In animals? Light response curve of a plant Too little light for photosynthesis n o i t a l i m i s s a T E N
Figure 07_21 Functional response - ingestion rate depends on food availability What sort of functional response Sit and wait was the plant light response curve? Constant search Prey Switching
Figure 07_23 Figure 07_24
Recommend
More recommend