CPVEC Sample Data 2000-2009 Ed White CPVEC Environmental Program Specialist
Definitions • Blackwater – water with human waste • Graywater – sink, shower, galley wastewater • mg/L - 1/1,000 gram per liter • µg/L - 1/1,000,000 gram per liter
Why Sample?
Ensuring samples are representative • Quality Assurance/Quality Control Plan • Vessel Specific Sampling Plan • Field notes, chain of custody • Unannounced sampling • Blind duplicates • Field audits • Lab audits
176 Parameters Sampled • “Conventional”- pH, Fecal Coliform, BOD, TSS, Chlorine. (16 parameters) • “Priority”- VOCs (70), BNAs (65), metals (25). • General Permit- Ammonia, Copper, Nickel, Zinc twice a month.
Sample Data Notes: • Frequency of samples taken varies over time • Number of ships sampled changes, individual vessels change • Metal filtering method changed
Conventional Parameters • pH • Fecal Coliform • Biochemical Oxygen Demand (BOD) • Total Suspended Solids (TSS) • Chlorine • Nutrients • Alkalinity
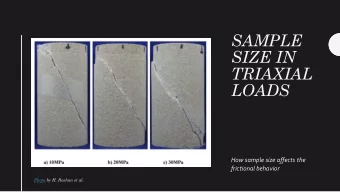
Fecal Coliform Averages 2000-2009 1,308,238 1,473,865 2,000,000 200,000 Count/100 ml 20,000 2,000 198 200 113 1 20 7 1 1 2000 2 25 2001 2002 2003 2004 2005 2006 2007 2008 2009 Average 2002- 2009 includes only AWTS systems 14 FC/100 mL Daily Max 43FC/100ml
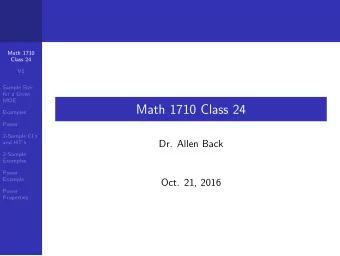
Biochemical Oxygen Demand 600 512.89 500 Max 400 Average 30 mg/L mg/L 300 200 Daily max 99.6 60 mg/L 100 21.8 9.54 7.1 4.87 6.11 5.15 5.52 5.5 0 2000 2001 2002 2003 2004 2005 2006 2007 2008 2009
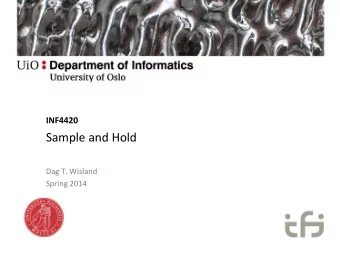
Total Suspended Solids (TSS) 430.53 450 400 350 300 256.6 250 mg/L 200 150 150 mg/L 100 50 17.3 8 3.74 2.25 2.3 1.47 1.49 0.4 0 2000 2001 2002 2003 2004 2005 2006 2007 2008 2009
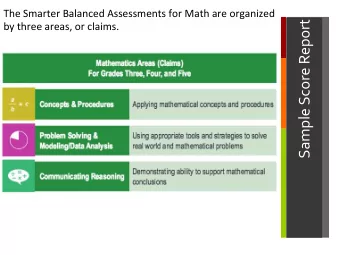
Chlorine Averages 2000-2009 3 2.74 2.5 2 1.45 mg/L 1.5 1 0.81 0.5 0.03 0 0 0 0 0 0 0 2000 2001 2002 2003 2004 2005 2006 2007 2008 2009 0.0075 mg/L
Ammonia Averages 2000-2009 60 52.28 50 44.8 42.7 40 35.53 34.9 35.4 34.4 32 mg/L 30 27.2 24.5 20 10 0 2000 2001 2002 2003 2004 1 mg/L 2005 2006 2007 2008 2009
60 Rochem Ammonia Samples (2004-2009) 50 40 mg/L 30 55.8 48.5 20 10 17.1 6.6 6.6 0.1 0 2004 2005 2006 2007 2008 2009 Rochem AWTS samples taken in Alaska. Includes some vessels that only discharged Graywater.
31 Scanship Ammonia Averages 2004-2009 30 29 28 mg/L 27 29.8 29.3 29.1 26 27.4 27.1 25 25.4 24 23 2004 2005 2006 2007 2008 2009 Norwegian CL and Serenade of the Seas. Based on ADEC reviewed sample results taken in Alaska.
30 Zenon Ammonia Averages 2004-2009 25 20 mg/L 15 24.5 20.5 10 15.7 15 13.5 11.6 5 0 2004 2005 2006 2007 2008 2009 Zenon AWTS. Results based on ADEC reviewed sample data.
Hamworthy (Princess) Ammonia Averages 2004-2009 80 70 60 50 mg/L 40 69 30 57.9 53.5 50.1 49.5 43.3 20 10 0 2004 2005 2006 2007 2008 2009 Hammworthy AWTS. Based on ADEC reviewed sample results taken in Alaska.
Hamworthy (Seven Seas Mariner) Ammonia Averages 2004-2009 50 45 40 35 30 mg/L 25 46.4 20 15 21.3 10 17.5 12.7 11.1 5 8.8 0 2004 2005 2006 2007 2008 2009 Hammworthy AWTS. Based on ADEC reviewed sample results taken in Alaska.
Seven Seas Mariner 2008-2009 Results 45 40 35 30 25 mg/L 42 40 20 33 15 29 29 10 19 16 13 11 11 9.9 5 8.3 7.8 7.4 6.9 3.4 6.7 0.23 4.7 1.8 0 1 2 3 4 5 6 7 8 9 10 11 12 13 14 15 16 17 18 19 20
Priority Parameters • Metals • Volatile Organic Compounds (VOCs) • Base/Neutral Acids (BNAs)
Copper(Dissolved) 133.85 140 120 100 80 µg/L 60 38.43 40 23.55 18.3 17.32 15.72 15.9 15.1 11.3 20 0 3.1 µg/L 2001 2002 2003 2004 2005 2006 2007 2008 2009
Nickel (Dissolved) 30 27.17 25 20.5 20 17.98 15.43 14.21 µg/L 15 11.6 10.54 9.7 9.5 10 8.2 µg/L 5 0 2001 2002 2003 2004 2005 2006 2007 2008 2009
Zinc (Dissolved) 175 169.5 180 160 140 119.73 118.8 81 µg/L 120 101.01 96.79 88.8 88.8 100 µg/L 80 62 60 40 20 0 2001 2002 2003 2004 2005 2006 2007 2008 2009
Thank You Ed White Alaska Dept of Environmental Conservation CPVEC edward.white@alaska.gov http:/ / www.dec.state.ak.us/ water/ cruise_ships/ reports.htm
Recommend
More recommend
Unleash a World of Digital Possibilities—Browse, Share, and Explore Content Without Boundaries