Continuous Profiling: (It's 10:43; Do You Know Where Your Cycles - PDF document
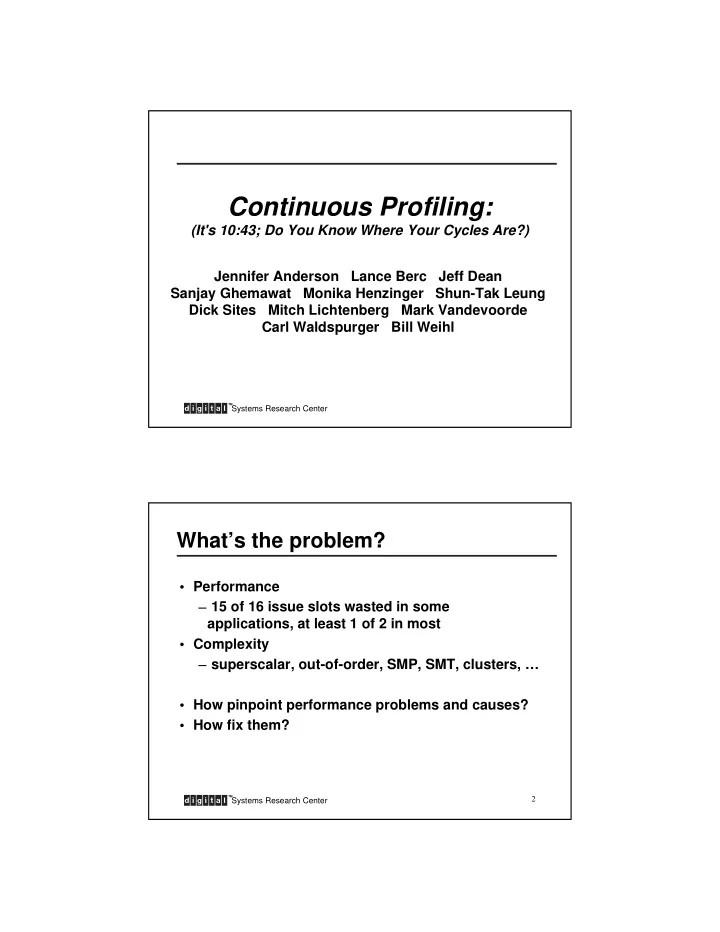
Continuous Profiling: (It's 10:43; Do You Know Where Your Cycles Are?) Jennifer Anderson Lance Berc Jeff Dean Sanjay Ghemawat Monika Henzinger Shun-Tak Leung Dick Sites Mitch Lichtenberg Mark Vandevoorde Carl Waldspurger Bill
Continuous Profiling: (It's 10:43; Do You Know Where Your Cycles Are?) Jennifer Anderson Lance Berc Jeff Dean Sanjay Ghemawat Monika Henzinger Shun-Tak Leung Dick Sites Mitch Lichtenberg Mark Vandevoorde Carl Waldspurger Bill Weihl TM Systems Research Center What’s the problem? • Performance – 15 of 16 issue slots wasted in some applications, at least 1 of 2 in most • Complexity – superscalar, out-of-order, SMP, SMT, clusters, … • How pinpoint performance problems and causes? • How fix them? TM Systems Research Center 2
Our solution • DIGITAL Continuous Profiling Infrastructure – Transparent – Complete – Efficient – Produces accurate fine-grained information – Designed for continuous use on production systems – Intended for programmers and optimization tools TM Systems Research Center 3 Related Work • Simulation ( e.g., SimOS) – slow • pixie et al. – single app – modifies executable • Samplers (prof, Morph, Vtune, SGI Speedshop) – some tied to existing interrupts (timers) – overhead often too high • None give accurate fine-grained information and low overhead TM Systems Research Center 4
System Overview: Acquiring and analyzing sample data User Space Load Modified Buffered map Analysis tools: dynamic samples system-, load-file-, procedure-, and info loader instruction-level daemon Kernel device driver Hash table exec Overflow log buffer profiles Load files Per-cpu data cpu 0 … cpu n In progress: optimization tools Hardware cycle counter ... cpu 0 ... cpu n imiss counter TM Systems Research Center 5 Load-file-level analysis example Total samples for event type cycles = 6095201, imiss = 1117002 The counts given below are the number of samples for each listed event type. ================================================================================ cycles % cum% imiss % procedure load file 2064143 33.87% 33.87% 43443 3.89% ffb8ZeroPolyArc /usr/shlib/X11/lib_dec_ffb_ev5.so 517464 8.49% 42.35% 86621 7.75% ReadRequestFromClient /usr/shlib/X11/libos.so 305072 5.01% 47.36% 18108 1.62% miCreateETandAET /usr/shlib/X11/libmi.so 271158 4.45% 51.81% 26479 2.37% miZeroArcSetup /usr/shlib/X11/libmi.so 245450 4.03% 55.84% 11954 1.07% bcopy /vmunix 209835 3.44% 59.28% 12063 1.08% Dispatch /usr/shlib/X11/libdix.so 186413 3.06% 62.34% 36170 3.24% ffb8FillPolygon /usr/shlib/X11/lib_dec_ffb_ev5.so 170723 2.80% 65.14% 20243 1.81% in_checksum /vmunix 161326 2.65% 67.78% 4891 0.44% miInsertEdgeInET /usr/shlib/X11/libmi.so 133768 2.19% 69.98% 1546 0.14% miX1Y1X2Y2InRegion /usr/shlib/X11/libmi.so TM Systems Research Center 6
Instruction-level analysis example s ( s = slotting hazard ) *** Best-case 8/13 = 0.62CPI dwD *** Actual 140/13 = 10.77CPI dwD ... 114.5 cycles dwD Addr Instruction Samples CPI Culprit 9834 stq t6, 16(t2) 174727 114.5 981c (cycles) (PC) s pD ( p = branch mispredict ) 9838 stq a0, 24(t2) 1548 1.0 pD ( D = DTB miss ) 983c lda t2, 32(t2) 0 ( dual issue ) 9810 ldq t4, 0(t1) 3126 2.0 9840 bne t4, 0x009810 1586 1.0 9814 addq t0, 0x4, t0 0 ( dual issue ) 9818 ldq t5, 8(t1) 1636 1.0 981c ldq t6, 16(t1) 390 0.5 9820 ldq a0, 24(t1) 1482 1.0 9824 lda t1, 32(t1) 0 ( dual issue ) C source code for assembly dwD ( d = D-cache miss ) code above (unrolled 4 times): dwD ... 18.0 cycles dwD ( w = write-buffer overflow ) for (i = 0; i < n; i++) 9828 stq t4, 0(t2) 27766 18.0 9810 c[i] = a[i]; 982c cmpult t0, v0, t4 0 ( dual issue ) 9830 stq t5, 8(t2) 1493 1.0 TM Systems Research Center 7 Procedure-level summary example I-cache (not ITB) 0.0% to 0.3% Slotting 1.8% ITB/I-cache miss 0.0% to 0.0% Ra dependency 2.0% D-cache miss 27.9% to 27.9% Rb dependency 1.0% DTB miss 9.2% to 18.3% Rc dependency 0.0% Write buffer 0.0% to 6.3% FU dependency 0.0% Synchronization 0.0% to 0.0% ------------------------------------------------------------- Subtotal static 4.8% Branch mispredict 0.0% to 2.6% ------------------------------------------------------------- IMUL busy 0.0% to 0.0% Total stall 48.9% FDIV busy 0.0% to 0.0% Execution 51.2% Other 0.0% to 0.0% Net sampling error -0.1% ------------------------------------------------------------- Unexplained stall 2.3% to 2.3% Total tallied 100.0% Unexplained gain -4.3% to -4.3% (35171, 93.1% of all samples) ------------------------------------------------------------- Subtotal dynamic 44.1% TM Systems Research Center 8
Generating samples in hardware • 2 or 3 hardware event counters • Overflow high-priority interrupt • Problem: inaccurate pc’s – 6-cycle delay – handler sees pc of oldest instruction in issue queue • So… can’t use counters to attribute most events to instructions – (NB: all existing event counters have this problem) TM Systems Research Center 9 Problems in acquiring samples in OS • Interrupt rate is very high – e.g., one sample every 62K cycles at 400 MHz: ~6,100 samples/sec • Primary issue: performance! – Cache misses are expensive (e.g., ~100 cycles/miss to memory) – If we took 10 cache misses at 100 cycles each, we’d incur ~1.5% overhead for the interrupt handler alone -- too much. TM Systems Research Center 10
Making OS software efficient • Aggregate samples in hash table – (pid, pc, event) count • Minimize cache misses and maximize benefit from each – 4-way associative tables – careful packing of data structures • Eliminate expensive synchronization operations – interprocessor interrupts for synchronization with handler TM Systems Research Center 11 Storing samples in a database • User-mode daemon: dcpid – extracts raw samples from driver – associates samples with load-files – updates disk-based profiles for load-files • Finding load-files from <PID, PC> – dcpiloader replaces default dynamic loader – exec hook for statically linked load-files • Profiles – text header + compact binary samples – organized by epoch and platform – can be shared among machines TM Systems Research Center 12
Performance of data collection • Time – 1-3% total overhead for most workloads – less than variation from run to run • Space – 512 KB kernel memory – 2-10 MB resident for daemon – 12 MB disk after one week of profiling on heavily used timeshared 4-processor server • Non-intrusive enough to be run for many hours on massive database machines TM Systems Research Center 13 Kinds of analysis provided • Aggregate info: – breakdown by load-file or function – compare raw profiles by load-file or function • Detailed info: – augmented control flow graph for a procedure • execution frequencies, CPI, reason(s) for stalls • source code (if available) – annotate source or asm w/ results of analysis – highlight differences in multiple profiles TM Systems Research Center 14
Converting cycle samples to CPI and frequency D Frequency C Flow Graph P I Cycles per instruction C Samples A L Reasons for stalls C • Cycle samples are proportional to total time at head of issue queue (where most interesting stalls occur) • Frequency indicates frequent paths • CPI indicates stalls TM Systems Research Center 15 Estimating frequency from samples • Problem – given cycle samples, compute frequency and CPI • Approach – Let F = Frequency / Sampling Period – E(Cycle Samples) = F X CPI – So … F = E(Cycle Samples) / CPI • Idea – If no dynamic stall, then know CPI, so can estimate F – Better accuracy: average sample counts from several instructions TM Systems Research Center 16
Finding instructions w/o dynamic stalls • Consider a group of instructions with the same frequency (e.g., basic block) • Assume some instructions execute without dynamic stalls • Use several heuristics to identify them; then average their sample counts • Key insight: – instructions without stalls have smaller sample counts TM Systems Research Center 17 Instructions w/o dynamic stalls (cont) • But … some small counts Addr Instruction Samples IP A are anomalous (e.g., 981c) 9810 ldq t4, 0(t1) 3126 * 9814 addq t0, 0x4, t0 0 • Avoid anomalies: Identify 9818 ldq t5, 8(t1) 1636 * 981c ldq t6, 16(t1) 390 issue points (IP) 9820 ldq a0, 24(t1) 1482 * * 9824 lda t1, 32(t1) 0 • Choose some IPs to 9828 stq t4, 0(t2) 27766 * average (A) 982c cmpult t0, v0, t4 0 9830 stq t5, 8(t2) 1493 * * 9834 stq t6, 16(t2) 174727 * • Average obtained: 1527 9838 stq a0, 24(t2) 1548 * * (actual value: 1575) 983c lda t2, 32(t2) 0 9840 bne t4, 0x009810 1586 * * • Does badly when: – few issue points – all issue points stall TM Systems Research Center 18
Recommend
More recommend
Explore More Topics
Stay informed with curated content and fresh updates.

