MALT : MALloc Tracker A memory profiling tool 3/02/2019 MALT, - PowerPoint PPT Presentation
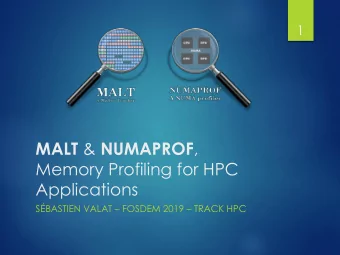
MALT : MALloc Tracker A memory profiling tool 3/02/2019 MALT, Sbastien Valat 1 Questions We have good profiling tool for timings (eg. Valgrind or vtune) But for what memory profiling ? Memory can be an issue : Availability of
MALT : MALloc Tracker A memory profiling tool 3/02/2019 MALT, Sébastien Valat 1
Questions • We have good profiling tool for timings (eg. Valgrind or vtune) • But for what memory profiling ? • Memory can be an issue : – Availability of the resource – Performance • Three main questions : – How to reduce memory footprint ? – How to improve overhead of memory management ? – How to improve memory usage ? 3/02/2019 MALT, Sébastien Valat 2
Some issue examples • I wanted to point : – Where memory is allocated. – Properties of allocated chunks. – Bad allocation patterns for performance. Global variables and TLS Indirect allocations __thread Int gblVar[SIZE]; int * func(int size) { Leak child_func_with_allocs(); void * ptr = new char[size]; double* ret = new double[size*size*size]; for (auto it : iter_Items) Might lead to swap for large size { double* buffer = new double[size]; C++11 auto induced allocs //short and quick do stuff delete [] buffer; } Short life allocations return ret; 3/02/2019 3 } MALT, Sébastien Valat
What I want to provide • Same approach than valgrind/kcachgind • Mapped allocations on sources lines and call stacks • Using a web-based GUI – I started with kcachgrind – But wanted more flexibility and time charts 3/02/2019 MALT, Sébastien Valat 4
How it works • Use LD_PRELOAD to intercept malloc /free/… as Google heap profiler • Map allocations on call stacks • Build & consolidate summary metrics • Generate JSON output file 3/02/2019 MALT, Sébastien Valat 5
Source annotations Web technology ( NodeJS , D3JS , Jquery , AngularS ) Inclusive/Exclusive Metric selector Per line annotation Call stacks reaching the selected Symbols Details of symbol or line site. 3/02/2019 MALT, Sébastien Valat 6
Call tree view 3/02/2019 MALT, Sébastien Valat 7
Per thread statistics 3/02/2019 MALT, Sébastien Valat 8
Fragmentation issue • Memory consumption over time – Physical – Virtual – Requested (malloced) 3/02/2019 MALT, Sébastien Valat 9
Dynamics 3/02/2019 MALT, Sébastien Valat 10
Example on AVBP init phase • Issue with reallocation on init • Detected with allocation rate & cumulated allocatated mem. Time 3/02/2019 MALT, Sébastien Valat 11
Usage • Optionally recompile with debug flags : gcc -g … • Run malt [--config=file.ini] YOUR_PRGM [OPTIONS] • Use the web view && http://localhost:8080: malt-webview -i malt-{YOUR_PRGM}-{PID}.json • In case there is a QT wrapper embedding NodeJS + Webkit malt-qt -i malt-{YOUR_PRGM}-{PID}.json 3/02/2019 MALT, Sébastien Valat 12
Status • Open sourced since one year on https://github.com/memtt • Co-hosted with a similar tool : NUMAPROF for Non Uniform Memory Access profiling. • My research on memory management for HPC : http://svalat.github.io/ 3/02/2019 MALT, Sébastien Valat 13
Thank you. QUESTIONS ? 3/02/2019 MALT, Sébastien Valat 14
BACKUP 3/02/2019 MALT, Sébastien Valat 15
Possibly huge impact Execution time (s) 500 • Memory management 450 can have huge impact on 4x 400 performance 350 300 • Extreme case on a 1.5 250 million C++ lines HPC 200 150 simulation app. on a 16 100 processors server 50 0 • Can see 10-15% improvement on MySQL by changing allocator User System Idle 3/02/2019 MALT, Sébastien Valat 16
Output, first idea, kcachegrind Callgrind compatibiltiy • Can use kcachgrind • Might be usefull for some users, cannot provide all metrics. 3/02/2019 MALT, Sébastien Valat 17
What is missing to kcachegrind • Started with kcacegrind GUI…. But … • Display human readable units – You prefer 15728640 or 15 MB ? – I want to compare to what I expect . • Cannot handle non sum cumulative metrics – Inclusive costs only rely on + operator – Some mem. metrics requires max/min (eg. lifetime) • No way to express time charts • No way to express parameter distributions (eg. sizes). 3/02/2019 MALT, Sébastien Valat 18
Ideas of improvement • Add NUMA statistics • Provide virtual/physical ratio • Estimate page fault costs • Exploit traces in GUI for deeper analysis – Alive allocations at a certain time – Fragmentation analysis – Time charts from call sites – Usage over threads for call sites 3/02/2019 MALT, Sébastien Valat 19
Global summary • Show global program statistics 3/02/2019 MALT, Sébastien Valat 20
Temporal metrics Profile over time : ▪ Allocation rate ▪ Physical / Virtual / Requested memory ▪ Stack size for each thread (require function instrumentation) Example on YALES2 with gfortran : 3/02/2019 MALT, Sébastien Valat 21
Chunk size distribution Example from YALES2 with gfortran issue Many really small allocations 3/02/2019 MALT, Sébastien Valat 22
EXISTING TOOLS 3/02/2019 MALT, Sébastien Valat 23
Existing tools • Valgrind (massif) – Memory over time (snapshots) & functions – Memory per function at peak – Has a simple GUI • Valgrind (memchek) – Leaks – No real GUI • Google heap profiler (tcmalloc) – Memory over time (snapshots) – Faster then valgrind – No GUI 3/02/2019 MALT, Sébastien Valat 24
Existing tools / Google heap profiler • Google heap profiler (tcmalloc): – Small overhead. – Similar metric than massif – Only provide snapshots of allocated memory per stacks . – Peak might not be captured. – Lack of a real GUI to use it. % pprof gfs_master profile.0100.heap 255.6 24.7% 24.7% 255.6 24.7% GFS_MasterChunk::AddServer 184.6 17.8% 42.5% 298.8 28.8% GFS_MasterChunkTable::Create 176.2 17.0% 59.5% 729.9 70.5% GFS_MasterChunkTable::UpdateState 169.8 16.4% 75.9% 169.8 16.4% PendingClone::PendingClone 76.3 7.4% 83.3% 76.3 7.4% __default_alloc_template::_S_chunk_alloc 49.5 4.8% 88.0% 49.5 4.8% hashtable::resize 3/02/2019 MALT, Sébastien Valat 25
Existing tools • TAU memory profiler – Provide profiles – Follow stacks – Track leaks – Parallel, done for HPC/MPI – Lack easy matching with sources • FOM 3/02/2019 MALT, Sébastien Valat 26
Existing tools / Commercials • IBM Purify++ / Parasoft Insure++ – Commercial – Leak detection, access checking, memory debugging tools. – Use binary or source instrumentation. – Windows / Redhat • Visual Studio Ultimate Edition Memory profiler – Nice but windows only and commercial 3/02/2019 MALT, Sébastien Valat 27
Stack tracking • Two approach implemented : backtrace and instrumentation • Backtrace (default) : – Work out of the box – Manage all dynamic libraries – Slow for large number of calls (~>10M) • Instrumentation : – Need source recompilation (available) : -finstrument-function – Or tools for binary instrumentation : MAQAO / Pintool (experimental) – Faster for really large number of calls to malloc – Only provide stacks for the instrumented binaries 3/02/2019 MALT, Sébastien Valat 28
What is good in kcachgrind • List of functions with exclusive/inclusive costs • Nice call tree • Annotated sources 3/02/2019 MALT, Sébastien Valat 29
SOME VIEWS 3/02/2019 MALT, Sébastien Valat 30
Global summary • Provide a small summary • Provide some warnings 3/02/2019 MALT, Sébastien Valat 31
Global summary : top 5 functions • Summarize top functions for some metrics • Points to check • Examples on YALES2 3/02/2019 MALT, Sébastien Valat 32
Tracking stack memory Display largest stack for thread ID Stack space used by functions on peak Thread ID Stack size over time 3/02/2019 MALT, Sébastien Valat 33
Chunk size distribution Example from YALES2 Many really small allocations 3/02/2019 MALT, Sébastien Valat 34
Global variables 3/02/2019 MALT, Sébastien Valat 35
REAL CASES 3/02/2019 MALT, Sébastien Valat 36
Performance 100 90 80 70 valgrind-memcheck 60 50 valgrind-massif 40 gperf 30 igprof 20 malt 10 malt-finstr 0 3/02/2019 MALT, Sébastien Valat 37
Allocatable arrays on YALES2 • Issue only occur with gfortran , ifort uses stack arrays. Search intensive alloc functions Huge number of allocation for a line programmer think it doesn’t do any ! And mostly really small allocations ! 3/02/2019 MALT, Sébastien Valat 38
We can found allocs of 1B ! • Examples on YALES 2, small allocations : Search for the minimal chunk size. Many codes produce allocations of 1B. OK with moderation. 3/02/2019 MALT, Sébastien Valat 39
Fragmentation issue • Example of fragmentation detection • Using the time chart with physical , virtual and requested memory • Solution : avoid interleaved allocation of chunks with different lifetime . • Looking on source annotation : most of them can be avoided . 3/02/2019 MALT, Sébastien Valat 40
Recommend
More recommend
Explore More Topics
Stay informed with curated content and fresh updates.
