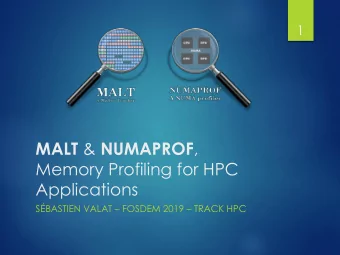
Transparent System Introspection in Support of Analyzing Stealthy - PowerPoint PPT Presentation
Transparent System Introspection in Support of Analyzing Stealthy Malware Kevin Leach PhD Dissertation kjl2y@virginia.edu November 30, 2016 Analogy: Volkswagen Scandal Volkswagen cheated on emissions test (over 10x EPA requirements) 2
Transparent System Introspection in Support of Analyzing Stealthy Malware Kevin Leach PhD Dissertation kjl2y@virginia.edu November 30, 2016
Analogy: Volkswagen Scandal ◮ Volkswagen cheated on emissions test (over 10x EPA requirements) 2
Analogy: Volkswagen Scandal ◮ Volkswagen cheated on emissions test (over 10x EPA requirements) ◮ Car was able to detect the test 2
Analogy: Volkswagen Scandal Volkswagen exploited the measurable difference between the EPA test and normal driving 3
Analogy: Volkswagen Scandal Volkswagen exploited the measurable difference between the EPA test and normal driving What about malware that detects analysis tools? 3
Overview 1. Motivation 2. Background ◮ Stealthy Malware Analysis and Artifacts ◮ Introspection 3. Hardware-assisted introspection and debugging ◮ Transparently acquire program data in two ways: 3.1 M AL T: Using SMM for Debugging 3.2 LO-PHI: Using DMA over PCIe for Introspection 4. Transparent program introspection ◮ H OPS : Limits of transparent program introspection 5. Conclusion 4
Motivation ◮ Symantec blocked an average of 250k attacks per day during 2014 ◮ McAfee reported 40M new malware samples during each quarter of 2015 ◮ Kaspersky reported 320k new threats per day in 2015 5
Malware Analysis Challenges ◮ Analysts want to quickly identify malware behavior 6
Malware Analysis Challenges ◮ Analysts want to quickly identify malware behavior ◮ What damage does it do? 6
Malware Analysis Challenges ◮ Analysts want to quickly identify malware behavior ◮ What damage does it do? ◮ How does it infect a system? 6
Malware Analysis Challenges ◮ Analysts want to quickly identify malware behavior ◮ What damage does it do? ◮ How does it infect a system? ◮ How do we defend against it? 6
Introspection ◮ Understanding program behavior 7
Introspection ◮ Understanding program behavior ◮ Debugger introspects program to access raw data ◮ Read variables ◮ Reconstruct stack traces ◮ Read disk activity 7
Introspection ◮ Understanding program behavior ◮ Debugger introspects program to access raw data ◮ Read variables ◮ Reconstruct stack traces ◮ Read disk activity ◮ Analyst infers behavior of a sample from interpreting this raw data 7
Introspection ◮ Understanding program behavior ◮ Debugger introspects program to access raw data ◮ Read variables ◮ Reconstruct stack traces ◮ Read disk activity ◮ Analyst infers behavior of a sample from interpreting this raw data ◮ Virtual Machine Introspection (VMI) ◮ Plugin for a Virtual Machine Manager (slowdown) ◮ Helper process inside guest VM (detectable process) 7
Introspection ◮ Understanding program behavior ◮ Debugger introspects program to access raw data ◮ Read variables ◮ Reconstruct stack traces ◮ Read disk activity ◮ Analyst infers behavior of a sample from interpreting this raw data ◮ Virtual Machine Introspection (VMI) ◮ Plugin for a Virtual Machine Manager (slowdown) ◮ Helper process inside guest VM (detectable process) But what if the program can detect our introspection tool? 7
Artifacts and Stealthy Malware ◮ Adversary achieves stealth by using artifacts to detect analysis tools 8
Artifacts and Stealthy Malware ◮ Adversary achieves stealth by using artifacts to detect analysis tools ◮ Measurable “tells” introduced by analysis 8
Artifacts and Stealthy Malware ◮ Adversary achieves stealth by using artifacts to detect analysis tools ◮ Measurable “tells” introduced by analysis ◮ Timing (nonfunctional) artifacts — overhead incurred by analysis ◮ single-stepping instructions with debugger is slow ◮ imperfect VM environment does not match native speed 8
Artifacts and Stealthy Malware ◮ Adversary achieves stealth by using artifacts to detect analysis tools ◮ Measurable “tells” introduced by analysis ◮ Timing (nonfunctional) artifacts — overhead incurred by analysis ◮ single-stepping instructions with debugger is slow ◮ imperfect VM environment does not match native speed ◮ Functional artifacts — features introduced by analysis ◮ isDebuggerPresent() — legitimate feature abused by adversaries ◮ Incomplete or unfaithful emulation of some instructions by VM ◮ Device names (hard disk named “VMWare disk”) 8
Artifacts and Stealthy Malware ◮ Adversary achieves stealth by using artifacts to detect analysis tools ◮ Measurable “tells” introduced by analysis ◮ Timing (nonfunctional) artifacts — overhead incurred by analysis ◮ single-stepping instructions with debugger is slow ◮ imperfect VM environment does not match native speed ◮ Functional artifacts — features introduced by analysis ◮ isDebuggerPresent() — legitimate feature abused by adversaries ◮ Incomplete or unfaithful emulation of some instructions by VM ◮ Device names (hard disk named “VMWare disk”) Significant effort to fully analyze each stealthy sample 8
Malware Analysis Triage System New Sample Signature developed Manual analysis (Time consuming) 9
Transparency ◮ We want accurate introspection even in the presence of stealthy malware ◮ We want transparency — no artifacts produced by analysis We want transparent system introspection tools to solve this ‘debugging transparency problem’ 10
Thesis Statement ◮ It is possible to develop a transparent system introspection tool by independently considering timing and functional artifacts 11
Architecture System Under Test (SUT) Remote Host Use cases Semantics Variables Function Calls Read Variables Userspace Code Under Test Read Stack Trace OS Introspection Kernel ( Spectre , VMI) SMM Memory PCIe Memory Hardware Acquisition Acquisition Component 1 – Hardware-assisted memory acquisition via PCI-e Component 2 – Hardware-assisted memory acquisition via SMM Component 3 – Transparent program introspection 12
Architecture System Under Test (SUT) Remote Host Use cases Semantics Variables Function Calls Read Variables Userspace Code Under Test Read Stack Trace OS Introspection Kernel ( Spectre , VMI) SMM Memory PCIe Memory Hardware Acquisition Acquisition Component 1 – Hardware-assisted memory acquisition via PCI-e Component 2 – Hardware-assisted memory acquisition via SMM Component 3 – Transparent program introspection 12
Architecture System Under Test (SUT) Remote Host Use cases Semantics Variables Function Calls Read Variables Userspace Code Under Test Read Stack Trace OS Introspection Kernel ( Spectre , VMI) SMM Memory PCIe Memory Hardware Acquisition Acquisition Component 1 – Hardware-assisted memory acquisition via PCI-e Component 2 – Hardware-assisted memory acquisition via SMM Component 3 – Transparent program introspection 12
Architecture System Under Test (SUT) Remote Host Use cases Semantics Variables Function Calls Read Variables Userspace Code Under Test Read Stack Trace OS Introspection Kernel ( Spectre , VMI) SMM Memory PCIe Memory Hardware Acquisition Acquisition Component 1 – Hardware-assisted memory acquisition via PCI-e Component 2 – Hardware-assisted memory acquisition via SMM Component 3 – Transparent program introspection 12
Architecture System Under Test (SUT) Remote Host Use cases Semantics Variables Function Calls Read Variables Userspace Code Under Test Read Stack Trace OS Introspection Kernel ( Spectre , VMI) SMM Memory PCIe Memory Hardware Acquisition Acquisition Component 1 – Hardware-assisted memory acquisition via PCI-e Component 2 – Hardware-assisted memory acquisition via SMM Component 3 – Transparent program introspection 12
Architecture System Under Test (SUT) Remote Host Use cases Semantics Variables Function Calls Read Variables Userspace Code Under Test Read Stack Trace OS Introspection Kernel ( Spectre , VMI) SMM Memory PCIe Memory Hardware Acquisition Acquisition Component 1 – Hardware-assisted memory acquisition via PCI-e Component 2 – Hardware-assisted memory acquisition via SMM Component 3 – Transparent program introspection 12
Overview 1. Motivation 2. Background ◮ Stealthy Malware Analysis and Artifacts ◮ Introspection ◮ Architecture 3. Hardware-assisted introspection and debugging ◮ Transparently acquire program data in two ways: 3.1 M AL T: Using SMM for Debugging 3.2 LO-PHI: Using DMA over PCIe for Introspection 4. Transparent program introspection ◮ H OPS : Limits of transparent program introspection 5. Conclusion 13
Hardware-Assisted Introspection ◮ Two approaches 1. M AL T, using System Management Mode (SMM) ◮ Significant timing artifacts ◮ No functional artifacts 2. LO-PHI, FPGA-based custom circuit ◮ Few timing artifacts ◮ Increased functional artifacts (e.g., DMA access performance counter) 14
SMM-based Memory Acquisition ◮ Intel x86 feature provides small, OS-transparent and -agnostic, trusted computing base ◮ Custom SMI Handler executed in SMM ◮ Code stored in System Management RAM (SMRAM) ◮ Trust only the BIOS ◮ Logically atomically executed transparently from OS 15
SMM Architecture System Management Mode Protected Mode OS / Program Code 1. Find program in memory SMI occurs SMI Handler 2. Dump to remote host 3. Configure next SMI OS / Program Code Resume from SMM 16
Recommend
More recommend
Explore More Topics
Stay informed with curated content and fresh updates.

