PerfMon redux: analyzing a CUDA application with the Windows PerfMon - PowerPoint PPT Presentation
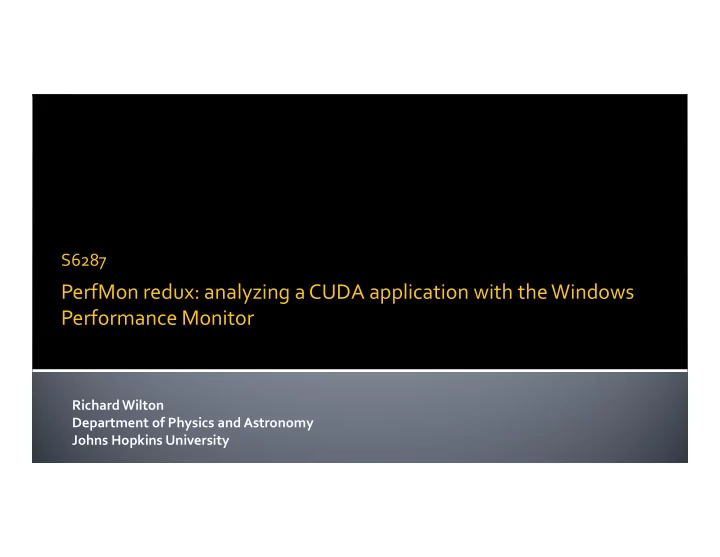
S6287 PerfMon redux: analyzing a CUDA application with the Windows PerfMon redux: analyzing a CUDA application with the Windows Performance Monitor Richard Wilton Department of Physics and Astronomy Johns Hopkins University S6287: Analyzing
S6287 PerfMon redux: analyzing a CUDA application with the Windows PerfMon redux: analyzing a CUDA application with the Windows Performance Monitor Richard Wilton Department of Physics and Astronomy Johns Hopkins University
S6287: Analyzing a CUDA What to monitor and why application with PerfMon What is there to monitor? � � Speed (duration) � Resource utilization � Interactions between resources � Interactions between resources Why bother? � � Prove that things are operating as expected � Make things run faster � Find performance bottlenecks � Identify resource contention
S6287: Analyzing a CUDA Setup for performance monitoring application with PerfMon Tools you need � � Microsoft Windows � NVidia GPU and CUDA toolkit (NVML) � Microsoft Visual Studio (PerfLib v2) � Microsoft Visual Studio (PerfLib v2) Monitoring setup � � Target machine with target hardware � Application “release” build � Choose your performance counters
S6287: Analyzing a CUDA Choosing performance counters application with PerfMon Counters in the GPU group: � Clock speed (MHz): memory � Clock speed (MHz): SM � Fan speed (% maximum) � Global memory allocated (bytes) � � Global memory allocated (percent) Global memory allocated (percent) � Global memory free (bytes) � Global memory read/write activity (%) � GPU compute activity (%) � GPU temperature (°C) � GPU total power draw (watts) � PCIe receive throughput (KB/s) � PCIe transmit throughput (KB/s)
S6287: Analyzing a CUDA Choosing performance counters application with PerfMon Monitoring everything at once is probably not a good idea.
S6287: Analyzing a CUDA Application pipeline (circa 2013) application with PerfMon � CPU compute activity � GPU (CUDA) compute activity
S6287: Analyzing a CUDA GPU activity application with PerfMon Device-related counters – device 0, 1, 2 � GPU compute activity % � Global memory read/write activity % Host-related counters � CPU activity % � CPU activity % � Host memory allocation
S6287: Analyzing a CUDA GPU activity application with PerfMon Device-related counters – device 0 � GPU compute activity % � Global memory read/write activity % Host-related counters � CPU activity % � CPU activity % � Host memory allocation
Sampling � Jaggedness S6287: Analyzing a CUDA application with PerfMon Device-related counters – device 0 � GPU compute activity % � Global memory read/write activity % Sampled at 1-second intervals Sampled at 1-second intervals Samples are “snapshots” (not averaged)
S6287: Analyzing a CUDA Concurrency among multiple GPUs application with PerfMon Device-related counters – device 0, 1, 2 � GPU compute activity % � Global memory read/write activity % Host-related counters � CPU activity % � CPU activity % � Host memory allocation
S6287: Analyzing a CUDA Concurrency among multiple GPUs application with PerfMon Device-related counters – device 0 � GPU compute activity % � Global memory read/write activity % Host-related counters � CPU activity % � CPU activity % � Host memory allocation
S6287: Analyzing a CUDA Concurrency among multiple GPUs application with PerfMon Device-related counters – device 1 � GPU compute activity % � Global memory read/write activity % Host-related counters � CPU activity % � CPU activity % � Host memory allocation
S6287: Analyzing a CUDA Concurrency among multiple GPUs application with PerfMon Device-related counters – device 2 � GPU compute activity % � Global memory read/write activity % Host-related counters � CPU activity % � CPU activity % � Host memory allocation
S6287: Analyzing a CUDA Starving for CPU cycles application with PerfMon Device-related counters – device 0, 1, 2 � GPU compute activity % � Global memory read/write activity % Host-related counters � CPU activity % � CPU activity % � Host memory allocation
S6287: Analyzing a CUDA Starving for CPU cycles application with PerfMon Device-related counters – device 0 � GPU compute activity % � Global memory read/write activity % Host-related counters � CPU activity % � CPU activity % � Host memory allocation
S6287: Analyzing a CUDA Consuming a resource application with PerfMon Device-related counters – device 2 � GPU compute activity % � Global memory allocated (bytes) (image TBD) Host-related counters � CPU activity % � CPU activity %
S6287: Analyzing a CUDA GPU mystery application with PerfMon Device-related counters – device 0, 1 � GPU compute activity % � Global memory read/write activity % � GPU temperature (°C) � GPU total power draw (watts) � GPU total power draw (watts) Host-related counters � CPU activity % � Host memory allocation
S6287: Analyzing a CUDA GPU mystery application with PerfMon Device-related counters – device 0, 1 � GPU compute activity % � Global memory read/write activity % � GPU temperature (°C) � GPU total power draw (watts) � GPU total power draw (watts) Host-related counters � CPU activity % � Host memory allocation
S6287: Analyzing a CUDA GPU mystery application with PerfMon Device-related counters – device 0, 1 � GPU compute activity % � Global memory read/write activity % � GPU temperature (°C) � GPU total power draw (watts) � GPU total power draw (watts) Host-related counters � CPU activity % � Host memory allocation
S6287: Analyzing a CUDA GPU mystery application with PerfMon Device-related counters – device 0, 1 � GPU compute activity % � Global memory read/write activity % � GPU temperature (°C) � GPU total power draw (watts) � GPU total power draw (watts) Host-related counters � CPU activity % � Host memory allocation
S6287: Analyzing a CUDA GPU mystery application with PerfMon Device-related counters – device 0, 1 � GPU compute activity % � Global memory read/write activity % � GPU temperature (°C) � GPU total power draw (watts) � GPU total power draw (watts) Host-related counters � CPU activity % � Host memory allocation
S6287: Analyzing a CUDA PerfMon and CUDA application with PerfMon What is there to monitor? � � Speed (duration) � Resource utilization � Interactions between resources � Interactions between resources Why bother? � � Prove that things are operating as expected � Make things run faster � Find performance bottlenecks � Identify resource contention
S6287: Analyzing a CUDA application with PerfMon Questions / Comments
Recommend
More recommend
Explore More Topics
Stay informed with curated content and fresh updates.
