Optimization Profiling VisualVM Exercise Meme Credit: Randall - PowerPoint PPT Presentation
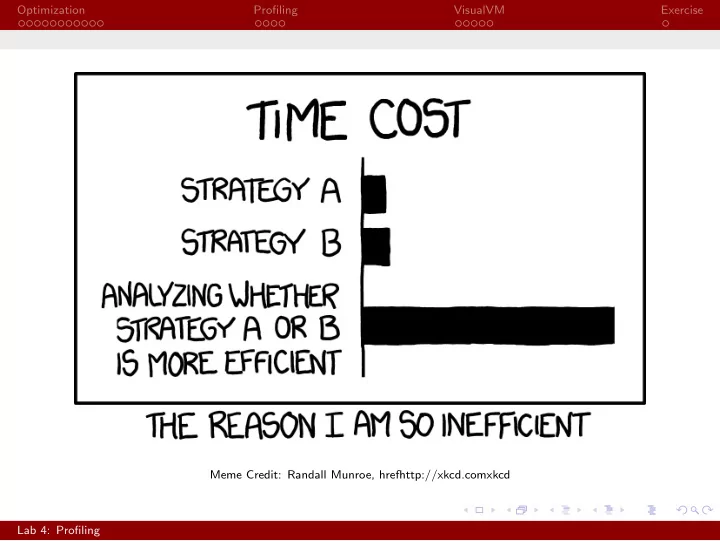
Optimization Profiling VisualVM Exercise Meme Credit: Randall Munroe, hrefhttp://xkcd.comxkcd Lab 4: Profiling Optimization Profiling VisualVM Exercise Lab 4: Profiling CS 2112 Fall 2020 September 28 / 30, 2020 Portions of todays lab
Optimization Profiling VisualVM Exercise Meme Credit: Randall Munroe, hrefhttp://xkcd.comxkcd Lab 4: Profiling
Optimization Profiling VisualVM Exercise Lab 4: Profiling CS 2112 Fall 2020 September 28 / 30, 2020 Portions of today’s lab slides are adapted from CS 4152 by Prof. Walker White Lab 4: Profiling
Optimization Profiling VisualVM Exercise Optimization Slow Operations Many normal operations are actually relatively slow. For example: ◮ Instantiating Objects ◮ Calling Methods ◮ Loops You’ll learn more about why in CS 3410 and CS 4410 Lab 4: Profiling
Optimization Profiling VisualVM Exercise Optimization Optimization? A common mistake is to attempt to optimize your code by not doing these slow things. One might try to make everything public, inline methods, unroll loops, etc. This is, however, a very bad idea . Lab 4: Profiling
Optimization Profiling VisualVM Exercise Optimization Premature Optimization “Premature optimization is the root of all evil” - Donald Knuth ◮ Compiler automatically optimizes code ◮ Almost always better than what a human can do Lab 4: Profiling
Optimization Profiling VisualVM Exercise Optimization Compiler Optimizations Raw Code Sample Compiler Output int x = 8 * y; int x = y << 3; 1 1 Lab 4: Profiling
Optimization Profiling VisualVM Exercise Optimization Compiler Optimizations Raw Code for (int i = 0; i < 5; i++) { 1 System.out.println(i); 2 } 3 Sample Compiler Output System.out.println (0); 1 System.out.println (1); 2 System.out.println (2); 3 System.out.println (3); 4 System.out.println (4); 5 Lab 4: Profiling
Optimization Profiling VisualVM Exercise Optimization Compiler Optimizations Raw Code int count = 0; 1 for (int i = 0; i < x; i++) { 2 count ++; 3 doSomething (); 4 } 5 Sample Compiler Output int count = 0; 1 if (x > 0) { 2 count = x; 3 doSomething (); 4 for (int i = 1; i < x; i++) { 5 doSomething (); 6 } 7 } 8 Credit: MSDN Magazine, 2/2015, “What Every Programmer Should Know About Compiler Optimizations” Lab 4: Profiling
Optimization Profiling VisualVM Exercise Optimization Compiler Optimizations Raw Code int sumTo(int n) { 1 int o = 0; 2 for (int i = 1; i <= n; i++) { 3 o += i; 4 } 5 return o; 6 } 7 8 return sumTo (10); 9 Sample Compiler Output return 55; 1 Credit: Matt Godbolt, CppCon 2017, “What Has My Compiler Done for Me Lately? Unbolting the Compiler’s Lid” Lab 4: Profiling
Optimization Profiling VisualVM Exercise Optimization Compiler Optimizations Raw Code int sumTo(int n) { 1 int o = 0; 2 for (int i = 1; i <= n; i++) { 3 o += i; 4 } 5 return o; 6 } 7 8 return sumTo(x); 9 Sample Compiler Output return x + x * (x - 1) / 2; 1 Credit: Matt Godbolt, CppCon 2017, “What Has My Compiler Done for Me Lately? Unbolting the Compiler’s Lid” Lab 4: Profiling
Optimization Profiling VisualVM Exercise Optimization Takeaway Compilers are very smart, and do a better job making small optimizations than people generally do. Take CS 4120 Compilers with Professor Myers to learn more. Lab 4: Profiling
Optimization Profiling VisualVM Exercise Optimization Tuning Performance ◮ Don’t overtune some inputs at the expense of others ◮ Be very cautious of making non-modular changes ◮ Focus on overall algorithm first Lab 4: Profiling
Optimization Profiling VisualVM Exercise Optimization 80/20 Rule ∼ 80% of the time is spent in ∼ 20% of the code The Real Question: What’s the 20%? Lab 4: Profiling
Optimization Profiling VisualVM Exercise Profiling Profiler A profiler is a tool used to measure the performance of code Lab 4: Profiling
Optimization Profiling VisualVM Exercise Profiling What Can We Measure? Time Memory ◮ Number of objects in ◮ What code takes longest memory ◮ What’s called most often ◮ Size of objects in memory ◮ Who’s calling what ◮ Potential memory leaks Lab 4: Profiling
Optimization Profiling VisualVM Exercise Profiling How to Measure Code Sampling Instrumentation ◮ Count at specified places ◮ Sample at periodic intervals ◮ Gives exact view of ◮ Low overhead specified slice ◮ May miss small things ◮ Targeted Lab 4: Profiling
Optimization Profiling VisualVM Exercise Profiling Time-Sampling Real Sampled Modern profilers fix with random sampling Lab 4: Profiling
Optimization Profiling VisualVM Exercise VisualVM VisualVM VisualVM is a Java profiler Get started by downloading it here: https://visualvm.github.io/. Lab 4: Profiling
Optimization Profiling VisualVM Exercise VisualVM VisualVM Interface VisualVM will automatically detect all running Java processes on your computer, with no additional setup required. They will be listed on the left, under Applications. Lab 4: Profiling
Optimization Profiling VisualVM Exercise VisualVM Monitor The monitor tab provides a quick, high-level overview of the state of your program. Here, you can see CPU and memory usage in real time. Lab 4: Profiling
Optimization Profiling VisualVM Exercise VisualVM Sampler / Profiler The sampler and profiler tab provide access to a sampling profiler and an instrumentation profiler, respectively. While the instrumentation profiler can be used to collect more accurate, targeted data if examining a specific part of your code, the sampler is easier to use and good enough for our purposes. Push either the “CPU” or “Memory” button to begin collecting data on runtime or memory usage, respectively. Sampling stops when “Stop” is pushed. The collected data will be displayed for you to explore. Lab 4: Profiling
Optimization Profiling VisualVM Exercise VisualVM Sampler / Profiler Lab 4: Profiling
Optimization Profiling VisualVM Exercise Exercise Exercise In the profiling folder, two files are included: StringRepeater and BetterStringRepeater . One uses a StringBuilder to concatenate Strings, and the other uses the concatenation operator. In this part of the lab, you will use VisualVM to study the performance of the code. Lab 4: Profiling
Recommend
More recommend
Explore More Topics
Stay informed with curated content and fresh updates.


