Profiling of Data-Parallel Processors Daniel Kruck 09/02/2014 - PowerPoint PPT Presentation
Profiling of Data-Parallel Processors Daniel Kruck 09/02/2014 09/02/2014 Profiling Daniel Kruck 1 / 41 Outline Motivation 1 Background - GPUs 2 Profiler 3 NVIDIA Tools Lynx Optimizations 4 Conclusion 5 09/02/2014 Profiling
Profiling of Data-Parallel Processors Daniel Kruck 09/02/2014 09/02/2014 Profiling Daniel Kruck 1 / 41
Outline Motivation 1 Background - GPUs 2 Profiler 3 NVIDIA Tools Lynx Optimizations 4 Conclusion 5 09/02/2014 Profiling Daniel Kruck 2 / 41
Motivation Outline Motivation 1 Background - GPUs 2 Profiler 3 NVIDIA Tools Lynx Optimizations 4 Conclusion 5 09/02/2014 Profiling Daniel Kruck 3 / 41
Motivation Why Data-Parallel Processors? Figure : Energy efficiency comparision: CPU vs GPU [1] high energy efficiency consume a huge part of the power-budget in HPC 09/02/2014 Profiling Daniel Kruck 4 / 41
Motivation Idea of Data-Parallel Processors Figure : Idea of data-parallel Figure : Worker thread executes processors [2] operation on its own element [3] 09/02/2014 Profiling Daniel Kruck 5 / 41 Figure : Motivation and idea of data-parallel processors
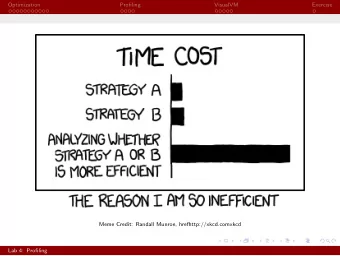
Motivation Why Profiling? 1st version 120 2nd version 3rd version 100 4th version 5th version BW in GB s 6th version 80 60 40 128 256 512 1 , 020 threads per block Figure : Device memory bandwidth with respect to threads per block. [4] collect runtime information optimize objective oriented 09/02/2014 Profiling Daniel Kruck 6 / 41
Background - GPUs Outline Motivation 1 Background - GPUs 2 Profiler 3 NVIDIA Tools Lynx Optimizations 4 Conclusion 5 09/02/2014 Profiling Daniel Kruck 7 / 41
Background - GPUs x86-CPU and GPU Quiz Figure : Which die is the CPU, which one the GPU? [3] 09/02/2014 Profiling Daniel Kruck 8 / 41
Background - GPUs GPU vs CPU Figure : GPU vs CPU [3] 09/02/2014 Profiling Daniel Kruck 9 / 41
Background - GPUs Programming Model Programming model Thread hierarchy: grid, block, warp (usually 32 threads), thread Shared memory as scratch-pad memory Barrier Synchronization Figure : Programming model 09/02/2014 Profiling Daniel Kruck 10 / 41
Background - GPUs GPU - Kepler Architecture Figure : Kepler full chip block [5] 09/02/2014 Profiling Daniel Kruck 11 / 41
Background - GPUs GPU - Kepler Warp Scheduler Figure : Kepler warp scheduler [5] 09/02/2014 Profiling Daniel Kruck 12 / 41
Background - GPUs GPU-Host Interface in this talk: the red blocks GPU and GPU memory are of interest transport of data to GPU memory is expensive GPU-GDDR5 memory features high bandwidth Figure : GPU-Host interface 09/02/2014 Profiling Daniel Kruck 13 / 41
Background - GPUs Summary The cachesize of a GPU is much smaller than of a CPU. Caches are used differently. The core-count of GPUs is much higher. The communication model between GPU-threads is more relaxed than between CPU-threads. Therefore, there are some differences in the programming model. Maximal GPU performance usually decreases the power-budget dramatically. Therefore, GPU applications should be optimized. Since there are a lot of mysterious concurrent things going on, runtime information can help to demystify the GPU. 09/02/2014 Profiling Daniel Kruck 14 / 41
Profiler Outline Motivation 1 Background - GPUs 2 Profiler 3 NVIDIA Tools Lynx Optimizations 4 Conclusion 5 09/02/2014 Profiling Daniel Kruck 15 / 41
Profiler Definitions (1) Definition “Application performance data is basically of two types: profile data and trace data.” [6] Definition “ Profile data provide summary statistics for various metrics and may consist of event counts or timing results, either for the entire execution of a program or for specific routines or program regions.” [6] Definition “In contrast, trace data provide a record of time- stamped events that may include message-passing events and events that identify entrance into and exit from program regions, or more complex events such as cache and memory access events.” [6] 09/02/2014 Profiling Daniel Kruck 16 / 41
Profiler Definitions (2) Definition “An event is a countable activity, action, or occurrence on a device. It corresponds to a single hardware counter value which is collected during kernel execution.” [7] Definition “A metric is a characteristic of an application that is calculated from one or more event values.” [7] 09/02/2014 Profiling Daniel Kruck 17 / 41
Profiler NVIDIA Tools NVIDIA Profiling Tools NVIDIA profiling tools nvprof : a command line profiler Visual Profiler : a tool to visualize performance and trace data generated by the nvprof NSight : a development platform that integrates nvprof and Visual Profiler are based on NVIDIA APIs CUPTI (CUDA Performance Tools Interface): a collection of four APIs, that “enables the creation of profiling and tracing tools” [8]. Through this API metric and event data can be queried, the nvprof can be controlled and a lot of other features are exposed. NVML (NVIDIA Management Library): through this library, thermal or power data can be queried. are designed to work with NVIDIA GPUs and are easy accessible in a NVIDIA environment 09/02/2014 Profiling Daniel Kruck 18 / 41
Profiler NVIDIA Tools nvprof - Getting Started help nvprof −− help query predefined events nvprof −− query − events query predefined metrics nvprof −− query − metrics 09/02/2014 Profiling Daniel Kruck 19 / 41
Profiler NVIDIA Tools nvprof example query nvprof −− events elapsed_cycles_sm −− p r o f i l e − from − s t a r t − o f f . / my_application Figure : Example output the stated nvprof-command 09/02/2014 Profiling Daniel Kruck 20 / 41
Profiler NVIDIA Tools NSight - Profiling View at a First Glance: Timeline Figure : Nsight profiling view: timeline 09/02/2014 Profiling Daniel Kruck 21 / 41
Profiler NVIDIA Tools NSight - Detection of Obvious Mistakes - Occupancy Definition Occupancy is the ratio between active warps and the maximum amount of active warps. Figure : Occupancy example: kernel block size to small 09/02/2014 Profiling Daniel Kruck 22 / 41
Profiler NVIDIA Tools NSight - Detection of Obvious Mistakes - Branch Divergency Definition Branch divergency on a GPU refers to divergent control-flow for threads within a warp. [9] source of branch divergence i f ( t i d % 2 == 0 ) s P a r t i a l s [ t i d ] += s P a r t i a l s [ t i d ] ; Figure : Example: branch divergence 09/02/2014 Profiling Daniel Kruck 23 / 41
Profiler NVIDIA Tools NSight - Detection of Obvious Mistakes - Coalesce Access Definition Coalesce access refers to to the aligned consecutive memory access pattern of an active warp. source of inefficient access pattern i f ( t i d == 0 ) out [ blockIdx . x ] = s P a r t i a l s [ 0 ] ; Figure : Example: global store inefficiency 09/02/2014 Profiling Daniel Kruck 24 / 41
Profiler PAPI & TAU PAPI & TAU PAPI (Performance Application Programing Interface) + has a broad userbase + gives access to common hardware counters through a consistent interface + portable code - is based on PAPI CUDA component - requires CUPTI-enabled driver TAU (Tuning and Analysis Utilities) + well-known to HPC developers consistent interface + portable code - TAU relies on CUDA library wrapping just like PAPI 09/02/2014 Profiling Daniel Kruck 25 / 41
Profiler Lynx Lynx Background : CUDA Compilation Process NVCC separates PTX from HOST code PTX code is later on translated to device code the compilation of PTX code can be ahead-of-time (AOT) or just-in-time (JIT) PTX code provides an opportunity for a custom instrumentation 09/02/2014 Profiling Daniel Kruck 26 / 41 Figure : Cuda compilation process
Profiler Lynx Lynx - Software Architecture + dynamic instrumentation + transparent, selective Figure : Lynx software architecture [10] 09/02/2014 Profiling Daniel Kruck 27 / 41
Profiler Lynx Lynx - Instrumentation Specifications + fine grain profiling + selective + transparent Figure : Lynx instrumentation specifications [10] 09/02/2014 Profiling Daniel Kruck 28 / 41
Profiler Lynx Lynx - Features + online profiling Features CUPTI Lynx Transparency (No Source Code Modifica- Yes Yes tions) Support for Selective Online Profiling No Yes Customization (User-Defined Profiling) No Yes Ability to Attach/Detach No Yes Support for Comprehensive Online Profiling No Yes Support for Simultaneous Profiling of Multiple No Yes Metrics Native Device Execution Yes Yes Figure : Distinctive features of lynx [10] 09/02/2014 Profiling Daniel Kruck 29 / 41
Profiler Lynx Summary NVIDIA Tools and Alternatives NVIDIA tools: + easy accessible in NVIDIA environment + common errors can be automatically detected with the automated analysis engine - no fine-grain profiling - not as selective and customizable as LYNX PAPI & TAU: + familiar to PAPI or TAU users - are basically wrapper libraries on NVIDIA APIs and therefore have the same strengths and weaknesses Lynx + transparent and highly selective instrumentation + not restricted to NVIDIA GPUs through the Ocelot-Cross-Compiler + online profiling possible - not pre-installed in NVIDIA environments ;) 09/02/2014 Profiling Daniel Kruck 30 / 41
Optimizations Outline Motivation 1 Background - GPUs 2 Profiler 3 NVIDIA Tools Lynx Optimizations 4 Conclusion 5 09/02/2014 Profiling Daniel Kruck 31 / 41
Recommend
More recommend
Explore More Topics
Stay informed with curated content and fresh updates.
