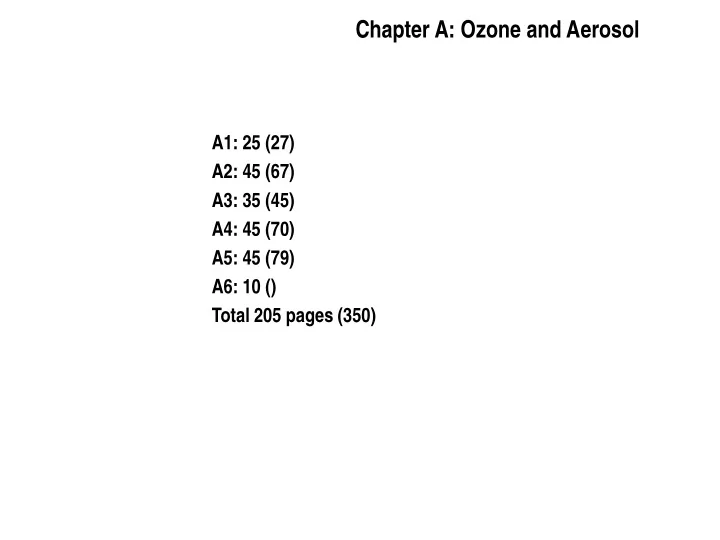

Chapter A: Ozone and Aerosol A1: 25 (27) A2: 45 (67) A3: 35 (45) A4: 45 (70) A5: 45 (79) A6: 10 () Total 205 pages (350)
Chapter A1; Concepts; Cooper/Derwent Minor changes: remove box 1.1; with the ‘science’ questions (rephrased anyhow) remove section 1.6 chapter story lines Figure 1.9 needs a new home (probably Chapter A6) Perhaps weak on aerosol
Chapter 2; Observations: Law Parrish -No major items missing but -Need to add some material on aerosol trends, NO2, CO and CH4 trends -Reduce length (references; combine some material, reducing sections) -Probably difficult to come to requested length reduction -Limited revisions in next two weeks; August/September major update
Chapter 3: Emissions; Van Aardenne/Streets •LA’s were not present on meeting; Savitri Garivait •Formatting figures may give requested page limits •Chapter is mainly on describing datasets- still need somewhere description of mitigation potential and cost-curves/contrability in conjunction with future scenarios •Description of Chapter 4 emissions •Time schedule tbd
Chapter 4 Modelling; Wild/Carmichael General: -Re-organizing; -cutting down of text improve aerosol part 2. Source Attribution: Idealised attribution of annual mean surface O3 at northern mid-latitude (Arctic?) showing source contributions from natural sources and methane (literature studies) and anthropogenic sources (estimated from S-R studies, and including inside/outside region distinction for a “typical” region). Can do for past and present conditions (Which future?) Graphical for surface O3; global tropospheric burden impacts in text. Equivalent plot for aerosol estimated from extended S-R runs directly 3. S-R Relationships Import sensitivity to be reintroduced; base on sum of other sources rather than out-of-region sources, as for Interim report (gives conservative estimate of effects). Variability within regions/by month is currently shown graphically (not in 2007). Relative strength of S-R pairs; currently these are tabulated, but will bring out the key relationships.
Chapter 4 Modelling; Wild/Carmichael 5. Future scenarios Quantify effect of changed emissions based on RCP8.5 2030 and RCP2.6 2050 scenarios – both on regional surface O3 and on S-R relationships (by linearization). Aim to do the same for aerosol. Highlight key changes due to expected climate change. 6. Uncertainties Characterise key uncertainties by reference to TP1x and ES studies, comparison of global and regional model results, etc. Emphasise awareness of uncertainty but avoid detracting from messages of chapter; comparison with measurements to illustrate current strengths and weaknesses. Will work with several place holder for first review draft
Chapter 5: Impacts/Health; West - We will try to include new results for PM mortality based on the SR6 simulations. This will give a better basis for comparing with ozone. - We will try to enlist help of more health effects experts to review and complete the text on the health effects of ozone and PM generally, including new figures. - We will complete the short sections on future health effects and recommendations for reducing uncertainty.
Chapter 5: Ecosystems - Restructure ; reduce; harmonize with other parts - coordinate with Chapter 4 (Ndep) - Some more quantitative analysis -more visual material -some more analysis
A5:Impact;Climate -We will reorganize much of the chapter around ozone RF and PM RF -This will leave sections at the end on climate impacts (dynamics) and the Arctic. - We will complete the short sections on future climate effects and recommendations for reducing uncertainty. Re-orgazing all sections wil address page limit issue
Chapter A6: Summary Status: - In draft- iterating with Chapters 2-5 for the messages; and key messages - Review draft probably only outline. Structure: • Observational Evidence: Events and Trends • Use of Modeling Analyses • Source Attribution • Source/Receptor Relationships • Impacts on AQ Standards, Health, Ecosystem, Climate • Effect of Expected Changes in Emissions and Climate • Implications for International Policy • Further Research and Analysis Needs
A6:O 3 Source Attribution (illustrative only, not quantitative) 140 1200 2000 50 Anthropogenic Pre Industrial 1800 45 120 1000 1600 40 100 1400 Natural 35 800 1200 80 30 600 1000 25 NOx/VOC/CO 60 800 20 400 in Region 40 600 15 400 10 200 20 NOx/VOC/CO 200 5 0 0 0 0 out of Region s O NO X VOC & CO CH 4 Methane O 3 140 1200 2000 Natural 50 1800 Present Day 45 120 1000 1600 40 100 1400 35 800 1200 80 30 600 1000 25 60 800 20 400 40 600 15 400 10 200 20 200 5 0 0 0 0 Emissions VOC and CO Concentration Emissions Ozone NOx CH4 Concentration
Addressing Part D: Synthesis Q1: Observational evidence for transport of ozone precursors and aerosols: a lot of material from surface, aircraft, satellite need to strengthen information on trends Q2: Source attribution; for ozone mainly based on modelling need to draw more on literature somewhat weak on controlability (add material also in Chapter 3) Q3: Source-Receptor; most work done- but needs some harmonisation Q4: Impacts: good material- need more on aerosol- some work-up of other material Q6: Processes (should also cover uncertainties) Obs. Based proces studies, uncertainty discussion in Ch. 4 Q7: Research: Measure better the vertical dimension for LRT Meas. Campaigns targetting specific uncertainties in LRT Advanced use of data, data assimilation, integrated systems Integrated ystems using measurements, models to improve emissions Q8: International cooperation networks-capacity building-harmonisation and exchange of information
Recommend
More recommend