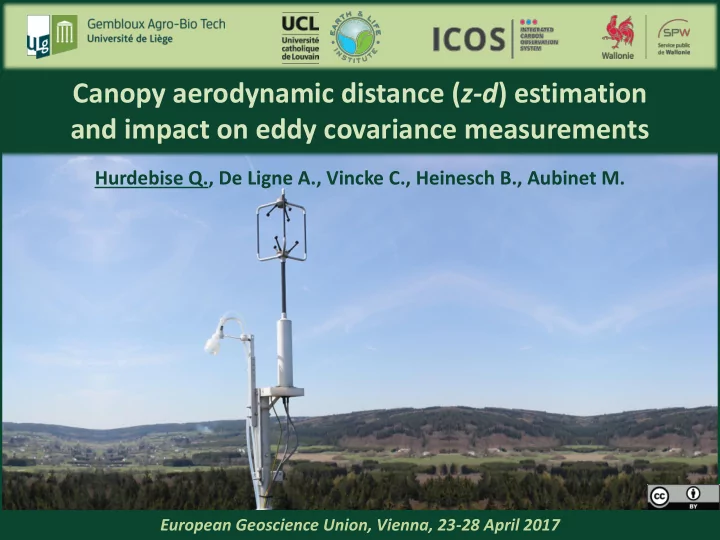

Canopy aerodynamic distance ( z-d ) estimation and impact on eddy covariance measurements Hurdebise Q., De Ligne A., Vincke C., Heinesch B., Aubinet M. Hurdebise Q. European Geosciences Union, Vienna, 23-28 April 2017 European Geoscience Union, Vienna, 23-28 April 2017 1
Context Method Results – Discussion Conclusion • Objectives: – Is turbulent transport impacted by canopy aerodynamic distance ( z – d ) variability in the roughness sublayer? – How to estimate canopy aerodynamic distance? Inertial sublayer Roughness sublayer Measurement height ( z ) Canopy aerodynamic distance ( z-d ) Displacement height ( d ) Hurdebise Q. European Geosciences Union, Vienna, 23-28 April 2017 2
Context Method Results – Discussion Conclusion • The Vielsalm Terrestrial Observatory (VTO) . “ ” Hurdebise Q. European Geosciences Union, Vienna, 23-28 April 2017 3
Context Method Results – Discussion Conclusion • The Vielsalm Terrestrial Observatory (VTO) . “ ” Hurdebise Q. European Geosciences Union, Vienna, 23-28 April 2017 4
Context Method Results – Discussion Conclusion • The Vielsalm Terrestrial Observatory (VTO) . “ ” Hurdebise Q. European Geosciences Union, Vienna, 23-28 April 2017 5
Context Method Results – Discussion Conclusion • Aerodynamic measurement height estimation based on cospectra : – Observed mean cospectrum – Theoretical cospectrum 1 wind direction Kaimal’s function 1 year 𝒐 (𝒜 − 𝒆) 𝒈 𝒜 − 𝒆 = 𝒈/𝒗 Poster A29 , 17:30 – 19:00 , Hall A 𝒗 Hurdebise Q. European Geosciences Union, Vienna, 23-28 April 2017 6
Context Method Results – Discussion Conclusion • Canopy aerodynamic distance ( z-d ): – Validation by confronting the results to : • the expected changes in d (as canopy height was variable) • the observed changes in z (as the measurement height was changed) Hurdebise Q. European Geosciences Union, Vienna, 23-28 April 2017 7
Context Method Results – Discussion Conclusion 𝑣𝑥 = 𝑣′𝑥′ ; 𝑠 𝑥𝑈 = 𝑥′𝑈′ 𝑥𝑑 = 𝑥′𝑑′ • Correlation coefficients : 𝑠 ; 𝑠 𝜏 𝑣 𝜏 𝑥 𝜏 𝑥 𝜏 𝑈 𝜏 𝑥 𝜏 𝑑 – may be referred to as normalized covariances or transport efficiencies as they indicate how much w is related to u , T and c . – repeatable measurements require constant correlation coefficient during all the measurement period −1 −1 −1 𝜏 𝑣 𝜏 𝑥 𝜏 𝑈 𝜏 𝑥 𝜏 𝑑 𝜏 𝑥 𝑠 𝑣𝑥 = ; 𝑠 𝑥𝑈 = ; 𝑠 𝑥𝑑 = 𝑣 ∗ 𝑣 ∗ 𝑈 𝑣 ∗ 𝑑 ∗ 𝑣 ∗ ∗ – r uw (neutral conditions): pronounced temporal dynamics – r wc and r wT (unstable conditions) : no temporal dynamics. – r uw , r wc and r wT : pronounced spatial variability ( r uw > r wT > r wc ). Hurdebise Q. European Geosciences Union, Vienna, 23-28 April 2017 8
Context Method Results – Discussion Conclusion • Canopy aerodynamic distance and correlation coefficients : −1 −1 −1 𝜏 𝑣 𝜏 𝑥 𝜏 𝑈 𝜏 𝑥 𝜏 𝑑 𝜏 𝑥 𝑠 𝑣𝑥 = ; 𝑠 𝑥𝑈 = ; 𝑠 𝑥𝑑 = 𝑣 ∗ 𝑣 ∗ 𝑈 𝑣 ∗ 𝑑 ∗ 𝑣 ∗ ∗ – Momentum correlation coefficient ( r uw ) is strongly linked to z-d . Characteristic of the roughness sublayer. – Heat and CO 2 correlation coefficients ( r uw , r wc , r wT ) independent of z-d . More homogeneous sources-sinks distribution. – Difference between azimuthal direction sectors in r wc and r wT (more pronounced) Not related to z-d variability. Hurdebise Q. European Geosciences Union, Vienna, 23-28 April 2017 9
Context Method Results – Discussion Conclusion • Why is there a difference between NE and W for r wT and r wc ? – Tree height transition between high Douglas firs and beeches? −1 −1 −1 𝜏 𝑣 𝜏 𝑥 𝜏 𝑈 𝜏 𝑥 𝜏 𝑑 𝜏 𝑥 𝑠 𝑣𝑥 = ; 𝑠 𝑥𝑈 = ; 𝑠 𝑥𝑑 = • Why is it more pronounced for r wT than for r wc ? 𝑣 ∗ 𝑣 ∗ 𝑈 𝑣 ∗ 𝑑 ∗ 𝑣 ∗ ∗ – Horizontal/vertical heterogeneity in sources/sinks distribution? – Large turbulence structures? – Occurrence of cloud passages? – Active role of temperature? Hurdebise Q. European Geosciences Union, Vienna, 23-28 April 2017 10
Context Method Results – Discussion Conclusion • Canopy aerodynamic distance ( z-d ) estimation: – Original z-d estimation method based on single point eddy covariance measurements with a relatively high temporal and spatial resolution. – z-d temporal dynamics and spatial variability fairly well reproduced. • Relation to turbulence statistics – r uw directly related to z-d roughness sublayer. – r wc and r wT not related to z-d even in the roughness sublayer – Other parameters need to be considered in order to explain the observed spatial variability. • Next step – Consider the fluxes themselves by considering footprint issues. Hurdebise Q. European Geosciences Union, Vienna, 23-28 April 2017 11
Thank you for your attention Hurdebise Q. European Geosciences Union, Vienna, 23-28 April 2017 European Geoscience Union, Vienna, 23-28 April 2017 12
More information? • quentin.hurdebise@ulg.ac.be • Poster session (A29, 17h30, Hall A) • Paper submitted (AFM) Hurdebise Q. European Geosciences Union, Vienna, 23-28 April 2017 European Geoscience Union, Vienna, 23-28 April 2017 13
Recommend
More recommend