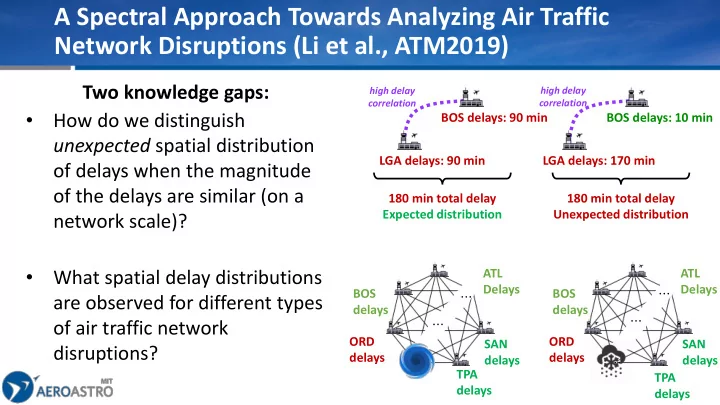

A Spectral Approach Towards Analyzing Air Traffic Network Disruptions (Li et al., ATM2019) Two knowledge gaps: high delay high delay correlation correlation How do we distinguish BOS delays: 90 min BOS delays: 10 min • unexpected spatial distribution LGA delays: 90 min LGA delays: 170 min of delays when the magnitude of the delays are similar (on a 180 min total delay 180 min total delay Expected distribution Unexpected distribution network scale)? ATL ATL What spatial delay distributions • Delays Delays ⋯ BOS BOS ⋯ are observed for different types delays delays ⋯ ⋯ of air traffic network ORD ORD SAN SAN disruptions? delays delays delays delays ⋯ ⋯ TPA TPA delays delays
Our solution: Graph signal processing to analyze spatial delay distributions [Widespread winter storms in ORD, NYC] [SFO, LAS fog + Augusta Masters] [Denver snowstorm] Key idea in this paper: Use Graph Signal Processing and total variation of graph signals to characterize expected vs. unexpected spatial delay distributions and relative differences, providing a systematic, low-dimensional, and generalizable methodology.
Important applications and extensions Airline-specific analysis of Phase portraits of the airline spatial delay distribution outliers recovery process after irregular Unexpected spatial distribution of operations delays during recovery (Days 3 & 4) Anomalous recovery Expected recovery trajectory trajectory Unexpected spatial Airline 2 … Airline 1 distribution of delays during Recovery (Day 4)
Recommend
More recommend