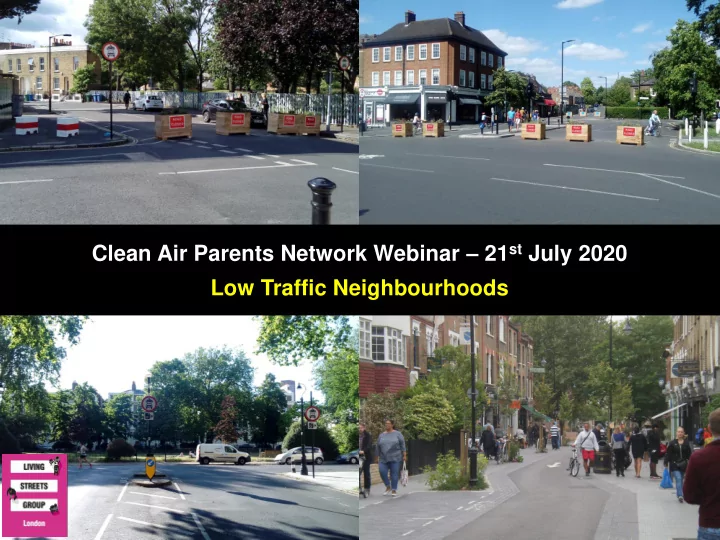

Clean Air Parents Network Webinar – 21 st July 2020 Low Traffic Neighbourhoods
WHY LOW TRAFFIC NEIGHBOURHOODS? • Part of the response to the damage motor traffic causes – road casualties, air quality, community, public health and active travel. • MUST be seen in conjunction with action to address traffic impacts on main roads. • Fuelled by pro-traffic policies since 2010 – no fuel duty rises, little regulation of PHVs, high cost of public transport, cuts to bus services, growth of car leasing.
WHY LOW TRAFFIC NEIGHBOURHOODS? 1. Rise of WAZE, Sav-Navs, Googlemaps and Uber. 2. Desire to make neighbourhood streets more liveable – COVID-19 experience. 3. Overall network management. The opportunity…potential for traffic evaporation In London 36% of car trips are under 2km
THE HOW OF LOW TRAFFIC NEIGHBOURHOODS
THE POLICY BACKGROUND DfT Reallocating road space: measures 23 rd May GLA/TfL Streetspace for London Plan 6 th May
BENEFITS Falling car usage - evaporation Local economy - pedestrian £ Air pollution Perceived improved environment Active travel Photo credit: Elaine Kramer
BENEFITS – AIR QUALITY • Research by LB Waltham Forest (modelled data) identified fall in the number of residential dwellings exposed to NO2 levels above 40 micrograms/m3 falling from 60,152 in 2007 to 6,353 in 2017. • Decline attributed to combination of controlled parking, emissions-based parking charges and Liveable Neighbourhoods. 2007 2017 https://www.walthamforest.gov.uk/sites/default/files/Population%20Exposure%20Comparison%20F1.pdf
WHERE? • Mid-June TfL Streetspace for London funding announcement – 195 funded projects including 77 LTNs in 14 inner and outer London boroughs.
CURRENT EXAMPLES Leahurst Road, Lee Green Lewisham (@MakeLeeGreen) Ipswich (@suffolkcc) Railton LTN Lambeth (@RailtonLTN) St Peter's Islington (@BrendaPuech)
MAIN ROADS http://www.londonair.org.uk/london/asp/annualmaps.asp (NO2)
MAIN ROADS • Evidence of traffic “evaporation” with LTNs BUT key to ensure residents on main roads and LTN boundary roads are also seeing improving air quality. • In designing LTNs, parallel work needed to reduce impact on main roads.
MAIN ROADS • Improvements to walking and cycling conditions (wider pavements/protected cycle lanes/improved crossing provision, lane/capacity reduction). • Local action - Bus and cycling only corridors/24/7 bus lanes. • Low Emissions Bus route. direct • Closing side roads to traffic. • Increasing on-street car parking charges. • Planting and greenery/green screens. • Increase residential car parking charges across the LA (/emissions-based charging). Local Authority • Car-free development. action - indirect • Small-area CPZs across the whole LA. • Sustainable freight networks. • Road User Charging (based on distance, emissions, and availability of public transport alternatives). • Clean Air Zones implemented. National, regional • London ULEZ 2021 (BUT all 33 boroughs!). and local • Phasing out diesel and petrol cars by 2030. government action • Support for active travel. • Workplace parking levies (WPL). • Public transport support.
ADDITIONAL RESOURCES • Mapping indicators to design LTNs Population Car Ownership http://content.tfl.gov.uk/lsp-app-six-b-strategic-neighbourhoods-analysis-v1.pdf
Recommend
More recommend