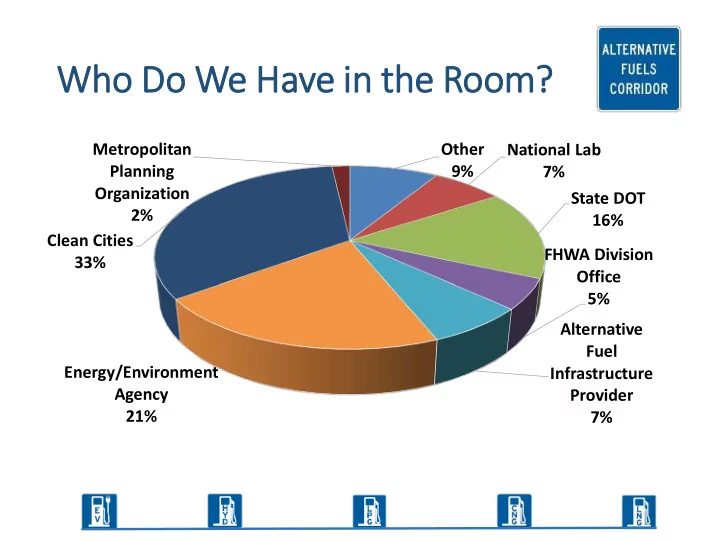

Who ho D Do W We Have i in t n the he Room? Metropolitan Other National Lab Planning 9% 7% Organization State DOT 2% 16% Clean Cities FHWA Division 33% Office 5% Alternative Fuel Energy/Environment Infrastructure Agency Provider 21% 7%
Which a alter ernative f e fuel el a are y e you most i inter erested ed i in advanc ncing ng/de depl ploying ng? Hydrogen 17% Propane (LPG) Electricity 17% 39% Natural Gas (CNG, LNG) 27%
Wha hat do do you t thin hink a are t the he t top barrie ba iers t to c creating s suc uccessful alter ernative f e fuel el c corridors? Consumer adoption of vehicles Lack of incentives/Financing Station economics Lack of awareness of alternative fuel benefits Low cost of conventional fuels Vehicle availability Supply <-> Market demand for alternative fuels Fuel supply Codes/Standards Lack of corridor specific planning tools/resources for siting Poor coordination among states Siting/NEPA process/Permitting Visibility from roadway 0 5 10 15 20 25 30 35
Which s h stakeho holde der(s) a are you u most l looking ng f forward t d to conne nnecting ing w with? State DOTs State Energy/Environment Agency staff FHWA Division Office staff Alternative Fuel Infrastructure Providers Utility representatives Clean Cities Coalitions MPOs/COGs/TPOs/Planning Agencies Fleet representatives Vehicle manufacturers/OEMs 0 5 10 15 20 25 30 35 40 45
What s single w wor ord d des escri ribes w what you ho u hope t to achi hieve t toda day? y?
Recommend
More recommend