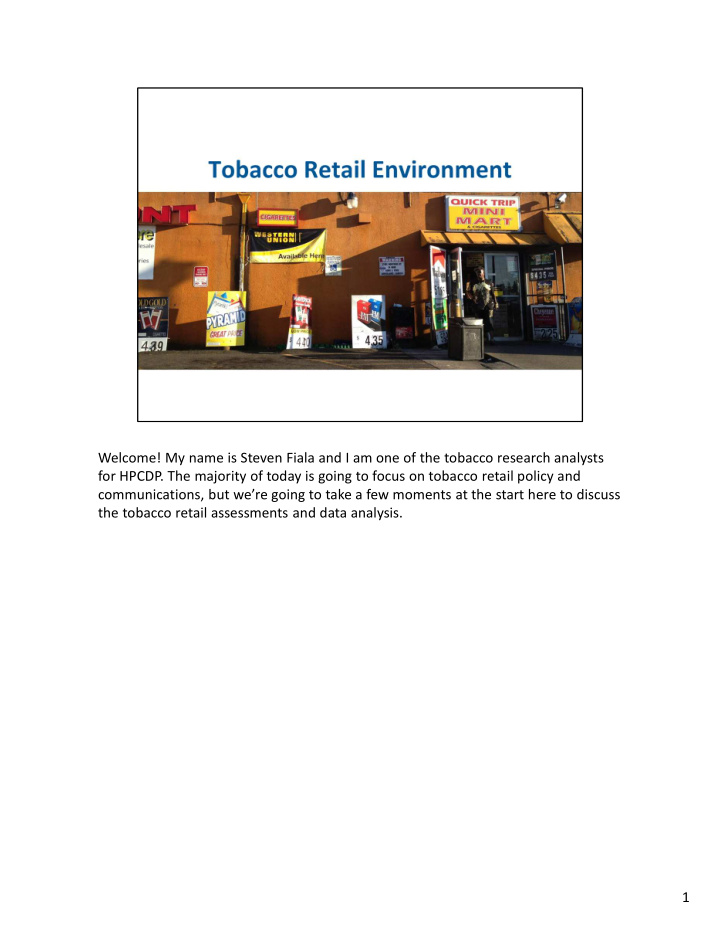


Welcome! My name is Steven Fiala and I am one of the tobacco research analysts for HPCDP. The majority of today is going to focus on tobacco retail policy and communications, but we’re going to take a few moments at the start here to discuss the tobacco retail assessments and data analysis. 1
1. How many of you have completed a tobacco retail assessment? 2. For those of you who have completed an assessment, how did the assessments go? - Reaction from retailers - Thoughts about the assessment tool - Organizing assessors 3. Did anything surprise you, either during the assessment or from the results of your assessment? 4. Was there anything you would have done differently? 5. Any lingering questions about the assessment process? 6. How many of you have analyzed the data from your retail assessment? 7. How many of you have used your data to identify a policy priority? 2
So, now that you have your data and you’ve identified the tobacco retail problem in your community, one next step will be delivering your results to stakeholders and key decision makers. 3
But which direct do you go? You all collected a lot of information and in talking with a few county coordinators, the intention of the retail assessment can get a bit lost in the jumble of numbers that are calculated. Which aspect of the assessment results do you focus on? 4
This is why I am going to give a very brief example of how to use your data to tell a story. This is only one example to get you started. Holly is going to provide a more extensive training on communicating your results, but we can consider this a start. 5
So, we start with this beautiful data collection instrument. This is actually an old version of the STARS survey. 6
To make it more sexy (and maybe more efficient), we put the survey on iPad Minis. 7
Now, we are ready for our assessments. And there is A LOT to assess. And yes, this is meant to be slightly overwhelming. 8
So, we assess! 9
Then, the data eventually reaches a number cruncher… 10
And the number cruncher sends you a report with a bunch of data tables that may look like this. In short, there is a lot to sift through. 11
Here are some general directions and examples for going from your mound of data to some simple messages and images. 12
First, distill your data. Focus on the most meaningful points groups of data. Rather than reporting the proportion of stores in your community that have outside advertising for cigarettes, electronic cigarettes, little cigars, etc. focus on the combination of these questions that allow you to make a statement about outside advertising of tobacco products in general. 13
So, let’s start with the proportion of tobacco retailers in a community with ANY tobacco product advertising within 3 feet of the floor inside the store (at a child’s eye level). 14
From this table we can say that 9 out of the 24 stores assessed displayed tobacco product advertisements within 3 feet of the floor. 15
Another way to say it would be that about 38% of stores assessed... 16
But we can make this statement even easier to understand by simplifying the proportion even further. Now we say that about 2 out of every 5 stores assessed… 17
This is the message you probably want to move forward with. Not 9 out of 25, probably not 38%, but two out of every five retailers in our community are placing tobacco advertising at the eye level of children. 18
But even with a simple, yet compelling message, we need something visual to pair it with. The connection of information to a visual helps with memory recall. 19
Photos taken during the assessment are a nice compliment to data statement. They make the data real and tangible. 20
Another example. 21
Or maybe you want to represent the data pictorially. 22
There are also other sources of information that can compliment your data. 23
Mapping of tobacco retailers near youth locations, like schools. 24
We also have a growing body of research on the effects of the retail environment on smoking behaviors. We know that exposure to tobacco advertising and promotion is associated with children who are never-smokers eventually becoming established smokers. 25
26
We also know that cigarette displays in general prompt impulse purchases of tobacco products among current smokers and those trying to quit. 27
Through the Federal Trade Commission, we also have information on how much the tobacco industry is investing in the retail environment. In 2011, they spent… 28
And of these advertising and marketing expenditures, over $8 billion (96%) was spent in the retail environment (mostly on price reductions and some on advertising and product displays). 29
In summary, data + a focused message + retail assessment photos + data visuals + mapping + outside sources (FTC report on tobacco marketing expenditures & national research) = … 30
Success! 31
Next we will be discussing tobacco retail policy options and communication strategies for this topic. 32
Questions? 33
Recommend
More recommend