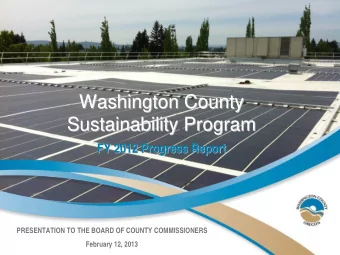
Washington County 2012-13 Budget Committee Meeting February 21, 2012
Agenda • Introductions • Election of Officers • Washington County – General Fund Update – Budget Policy Overview – Miscellaneous Updates • Legislative Update • ESPD and URMD – Operational Updates • Budget Committee Key Dates
Elections • Washington County – Current Chair: John Cook – Current Secretary: Leroy Bentley • ESPD and URMD – Current Chair: Walt Gorman
General Fund Reserves Ending Fund Balance as a % of Total Revenues 25.0% 20.0% 20.0% 19.3% 18.8% 18.2% 17.5% 15.0% 16.8% 19.1% 15.4% May 2011 13.8% 10.0% 5.0% Board policy is to maintain ending fund balance at 20% or greater of total revenues and not less than 15% of total revenues 0.0% 2009-10 2010-11 2011-12 2012-13 2013-14 2014-15 2015-16 2016-17
Economic and Activity Level Indicators • Washington County – Unemployment – Employment growth • GF Discretionary Revenues – Real estate transfer tax – Lodging tax – Interest income • Recording Division Fees • Justice Court Fines
2012-13 Budget Policy • Provide an ending fund balance within the Board approved goal of 20% of General Fund resources (minimum of 15%) • Emphasis on limiting the expenditure growth in the General Fund to no more than 3.0%; current staffing levels • Status quo General Fund transfers to Special Fund budgets – reductions where feasible • Losses in dedicated revenues not replaced with General Fund resources • Transfers to MSTIP/WCCLS tied to growth in assessed value • Board may modify transfer amounts as it deems necessary through the budget process
Miscellaneous Updates • Technology Capital Projects • Employee Health Care Costs – Benefits Committee – Request for Proposal – Premium Share • Cost of Living • Video Lottery – New State Requirements • Fairgrounds
Budget Committee Key Dates • May 8, 2012 – Budget materials available • May 15, 2012 – Budget Committee meeting at 11:30 in the Law Enforcement Center training rooms • May 24, 2012 Budget Committee public hearing at 8:30 in the auditorium of the Charles D. Cameron Public Services Building • Budget Committee for the newly formed North Bethany County Service District will also be present
ESPD Budget Committee 2012
2011 Calls For Service Public Demand Calls for Service • WCSO Total – 47,050 • ESPD – 33,649 (72% of total)
Calls For Service 2009 2010 2011 Public Demand 35,586 34,649 33,649 Self Initiated 36,419 42,650 42,060 TOTAL 72,005 77,299 75,709
Calls for Service (CFS) Bethany, Rock Creek, Cedar Mill (20 / 21 Beats) • CFS: 8,566 • Population: 52,833 • CFS per 1,000 population: 162
Calls for Service (CFS) Cedar Hills, Raleigh Hills, Garden Home (30 / 31 Beats) • CFS: 7,034 • Population: 21,600 • CFS per 1,000 population: 326
Calls for Service (CFS) Bull Mountain (40 / 41 Beats) • CFS: 2,729 • Population: 9,133 • CFS per 1,000 population: 299
Calls for Service (CFS) Aloha – Reedville (Beats 50/51/60/61) • CFS: 15,320 • Population: 49,425 • CFS per 1,000 population: 310
DUII Arrests 2011 • 2009: 1,219 • 2010: 1,179 • 2011: 1,278
Warrants & Sex Offender Compliance Checks (2011) • Attempted Warrant Services 3,680 – Felony Warrants Served 415 – Misdemeanor Warrants Cleared 758 • Sex Offender Home Visits 1,780 • Sex Offender Investigations 929 • Out of compliance arrests 120
Neighborhood Safety Source: Community Survey Benchmark, July 2011
Impact of Crime 2011 n=400 Source: Community Survey Benchmark, July 2011
ESPD Source: ESPD Survey, January 2012
Effectiveness UCR – Part 1 Violent Crimes per 100,000 ( Murder � Manslaughter � Forcible Rape � Robbery � Felony Assault) 400 Oregon City A City B WCSO 350 300 250 200 150 100 50 Year * WCSO Data w as calculated using UCR Crimes and 2010 Census population data ** According to the UCR w ebsite: "Because of changes in the state's reporting practices, figures are not comparable to previous years' data" 0 2000 2001 2002 2003 2004 2005 2006 2007 2008 2009 2010**
Effectiveness UCR – Part 1 Property Crimes per 100,000 7000 Oregon City A City B WCSO 6000 5000 4000 3000 2000 1000 Year * WCSO Data w as calculated using UCR Crimes and 2010 Census population data * According to the UCR w ebsite: "Because of changes in the state's reporting practices, figures are not comparable to previous years' data" 0 2000 2001 2002 2003 2004 2005 2006 2007 2008 2009 2010**
Next Generation Patrol Vehicle • Ford discontinued production of Crown Victoria Police Interceptor – March 2011 • Panel formed mid-2010 to begin research of alternatives • Demos and site visits Hillsboro, Portland, Seattle, Pasadena • Caprice, Tahoe and Charger loaned to WCSO each for multiple weeks • Ford- February 16, 2012 in Seattle last demo
Next Generation Patrol Vehicle • Chevy Caprice and Chevy Tahoe overwhelming majority of deputies recommend these two service vehicles
ESPD A unique way to deliver highly effective, efficient police services.
Update on Progress: URMD Audit Recommendations • Revise IGA between URMD and County to identify service levels and performance measures – New IGA • Sets target Pavement Condition Index (PCI) • Includes performance measures / expectations
Update on Progress: URMD Audit Recommendations • With input from URMD Committee, consider revising URMD Ordinance to define services and service levels – New URMD ordinance • Retains focus on maintenance • Allows construction of safety improvements
History / Background • Serial levy – 1994 – 5 years – Rate .365/ 1,000 – Bring roads up to “Fair or Better” – Measures 47 & 50 (no sunset, rate .245/1,000) – “Maintenance” only – PCI – 94.5% good – very good, average is 84 • Projected 2011-12 revenue – $3.6m • Projected 2011-12 contingency – $5.1m
URMD Road Condition Very Good 430 centerline miles in URMD Gravel Poor Good Fair Average Pavement Condition Index (PCI) is 84
Maintained vs Non-Maintained URMD Road Cost per Mile for 2 Lane Road Pavement Condition Index (PCI) Maintained Non-Maintained 100 Very good 80 Good 60 Maintained Seal Seal Seal Seal Overlay Seal Seal Overlay = Total = Fair $24 K $24 K $194 K $24 K $24 K $194 K $24 K $24 K $532 K 40 Poor 20 Non- Maintained The poorer the road, the Rebuild Very poor Rebuild = Total = greater the liability. $550 K $550 K $1,100 K 0 0 10 20 30 40 50 Years 60 70 80 Rev. 1/19/11
Funding Scenario Examples
Maintaining Current Spending on Pavements $1,600,000 90 80 $1,400,000 70 2020 $1,200,000 PCI: 78 60 $1,000,000 50 $ $800,000 PCI 40 $600,000 30 $400,000 20 $200,000 10 $0 0 2010 2012 2014 2016 2018 2020 2022 2024 2026
Zero Spending On Pavements 90 2020 $1,400,000.00 PCI: 71 80 $1,200,000.00 70 $1,000,000.00 60 50 $800,000.00 $ PCI 40 $600,000.00 30 $400,000.00 20 $200,000.00 10 $0.00 0 2010 2012 2014 2016 2018 2020 2022 2024 2026
Priority Shift Provides about $17 million over 10-years $16,000,000 90 2020 PCI: 74 80 $14,000,000 70 $12,000,000 60 $10,000,000 Surface $ 50 Fund Balance $8,000,000 Basement 40 $ Available $6,000,000 PCI 30 $4,000,000 20 $2,000,000 10 $0 0 2010 2012 2014 2016 2018 2020 2022 2024 2026 (April 2011)
URMDAC Recommendation • Continue focus on pavement maintenance and allocate a portion of funds toward making safety improvements. – $800k Surface Treatments – $250k Reconstruction – $450k Safety Improvements
Questions?
Recommend
More recommend
Unleash a World of Digital Possibilities—Browse, Share, and Explore Content Without Boundaries