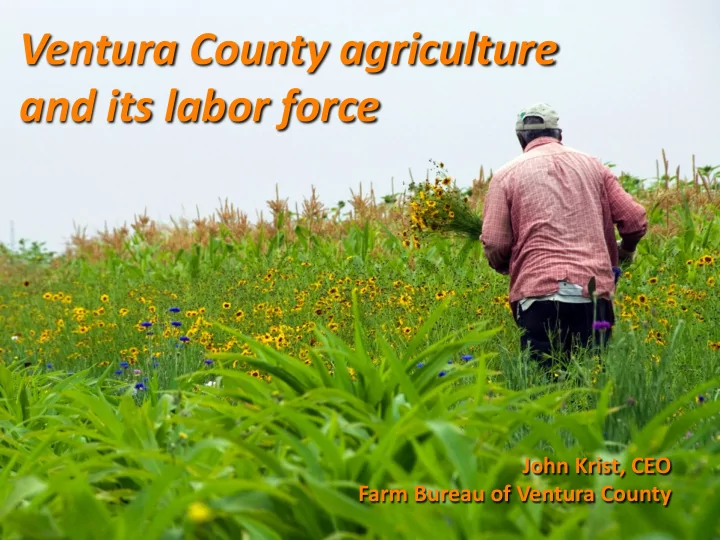

Ventura ¡County ¡agriculture ¡ and ¡its ¡labor ¡force John ¡Krist, ¡CEO ¡ Farm ¡Bureau ¡of ¡Ventura ¡County
Characteristics of Ventura County agriculture • Diverse • Small • High-value • Labor-intensive Characteristics of Ventura County farm workers • Foreign-born • Largely undocumented • Low wages • Mostly permanent residents
Characteristics of VC agriculture
Harvested ¡cropland: ¡89,321 ¡acres ¡ Acres ¡converted ¡from ¡farmland ¡ ¡ Urbanized ¡land: ¡105,461 ¡ to ¡urban ¡uses ¡1992-‑2012: ¡8,772
Commodities produced by Farm Bureau members Alfalfa Nectarines Broccoli Christmas trees Grapefruit Raspberries Apples Nursery stock Brussels sprouts Cilantro Herbs Sage Arugula Olives Cabbage Collard Hogs Sheep Artichokes Oranges Cantaloupes Container plants Honey Spinach Avocados Parsley Carrots Corn Kale Squash Barley Peaches Cattle Cucumber Kiwi Strawberries Beans (Lima) Pears Cauliflower Dill Kohlrabi Sunflowers Beans (Green snap) Peas Celery Ducks Leek Swiss chard Bees Peppers Cherimoyas Eggs Lemons Tangerines Beneficial insects, Pimentos Cherries Eggplant Lettuce Tomatoes nematodes and Plums Chicory Endive Limes Turf/sod snails Potatoes Chinese Fennel Mint Turnips Blackberries Pumpkins Cabbage Flowers Mizuna Watercress Blueberries Radishes Chinese greens Gai Lon Mushrooms Watermelon Bok choy Rapini Chives Grapes Mustard Zucchini
By the numbers • Number of farms in VC: 2,150 • Average size: 131 acres • Statewide average: 328 acres • National average: 434 acres • VC median: 12 acres • Percentage <50 acres: 78% • Orchard crops: 41,027 acres • Berries, vegetables: 59,674 acres
• No. ¡9 ¡ag ¡county ¡in ¡California, ¡ CALIFORNIA No. ¡10 ¡in ¡U.S. ¡ County AGRICULTURAL COMMISSIONERS’ • Total ¡crop ¡value: ¡$2.1 ¡billion ¡ REPORTS ¡ 2012 • Average ¡per ¡acre: ¡$23,500 ¡ ¡ • Real ¡increase ¡in ¡per-‑acre ¡ value ¡since ¡1998: ¡50% ¡ ¡ • 9 ¡Hmes ¡the ¡per-‑acre ¡value ¡of ¡ No. ¡1 ¡(Fresno) ¡ CDFA California Agricultural Statistics P .O. Box 1258 Sacramento, CA 95812-1258 (916) 498-5161 • NaHon’s ¡leading ¡producer ¡of ¡ www.nass.usda.gov/ca lemons, ¡raspberries
No. ¡1: ¡Strawberries ¡ $609 ¡million ¡ 13,555 ¡acres ¡ No. ¡2: ¡Avocados ¡ $210 ¡million ¡ 20,121 ¡acres ¡ No. ¡3: ¡Raspberries ¡ $196 ¡million ¡ 4,286 ¡acres ¡
No. ¡4: ¡Nursery ¡stock ¡ $186 ¡million ¡ 3,194 ¡acres ¡ ¡ (field ¡access) ¡ 7 ¡million ¡sq. ¡P. ¡ (greenhouses) ¡ No. ¡5: ¡Lemons ¡ $190 ¡million ¡ 15,345 ¡acres ¡
Characteris9cs ¡of ¡ ¡ VC ¡agricultural ¡ ¡ labor ¡force
Ventura County’s ag labor force Born outside of the U.S.: 95% Of those, percentage born in Mexico: 96% Average length of time in U.S.: 11 years Percentage lacking legal status: 57% Percentage with U.S. citizenship: 10% Percentage who speak only Spanish: 53% Median age: 32 Source: Results from California counties sampled by National Agricultural Workers Survey (2004)
Average Ventura County Annual Agricultural Wages 1990-2012 (Nominal) $35,000 $29,242 $30,000 $25,000 $20,000 $16,797 + 74% $15,000 $10,000 $5,000 $0 1990 1991 1992 1993 1994 1995 1996 1997 1998 1999 2000 2001 2002 2003 2004 2005 2006 2007 2008 2009 2010 2011 2012 Includes the following industry sectors: NAICS Code 111 Crop Production 1112 Vegetable and Melon Farming 1113 Fruit and Tree Nut Farming 1114 Greenhouse, Nursery, and Floriculture Production 115 Support Activities for Agriculture and Forestry Source: California Employment Development Department
Average Ventura County Annual Agricultural Wages 1990-2012 (Constant 1990 Dollars) $30,000 $25,000 $20,000 $16,797 $15,000 $16,257 - 3% $10,000 $5,000 $0 1990 1991 1992 1993 1994 1995 1996 1997 1998 1999 2000 2001 2002 2003 2004 2005 2006 2007 2008 2009 2010 2011 2012 Includes the following industry sectors: NAICS Code 111 Crop Production 1112 Vegetable and Melon Farming 1113 Fruit and Tree Nut Farming 1114 Greenhouse, Nursery, and Floriculture Production 115 Support Activities for Agriculture and Forestry Source: California Employment Development Department
Average Ventura County Agricultural Employment 1990-2012 50,000 45,491 45,000 40,000 35,000 30,000 24,771 + 84% 25,000 20,000 15,000 10,000 5,000 0 1990 1991 1992 1993 1994 1995 1996 1997 1998 1999 2000 2001 2002 2003 2004 2005 2006 2007 2008 2009 2010 2011 2012 Jobs in all categories, including support Includes the following industry sectors: NAICS Code 111 Crop Production 1112 Vegetable and Melon Farming 1113 Fruit and Tree Nut Farming 1114 Greenhouse, Nursery, and Floriculture Production 115 Support Activities for Agriculture and Forestry Source: California Employment Development Department
Thank ¡you! www.farmbureauvc.com (805) ¡289-‑0155 info@farmbureauvc.com
Recommend
More recommend