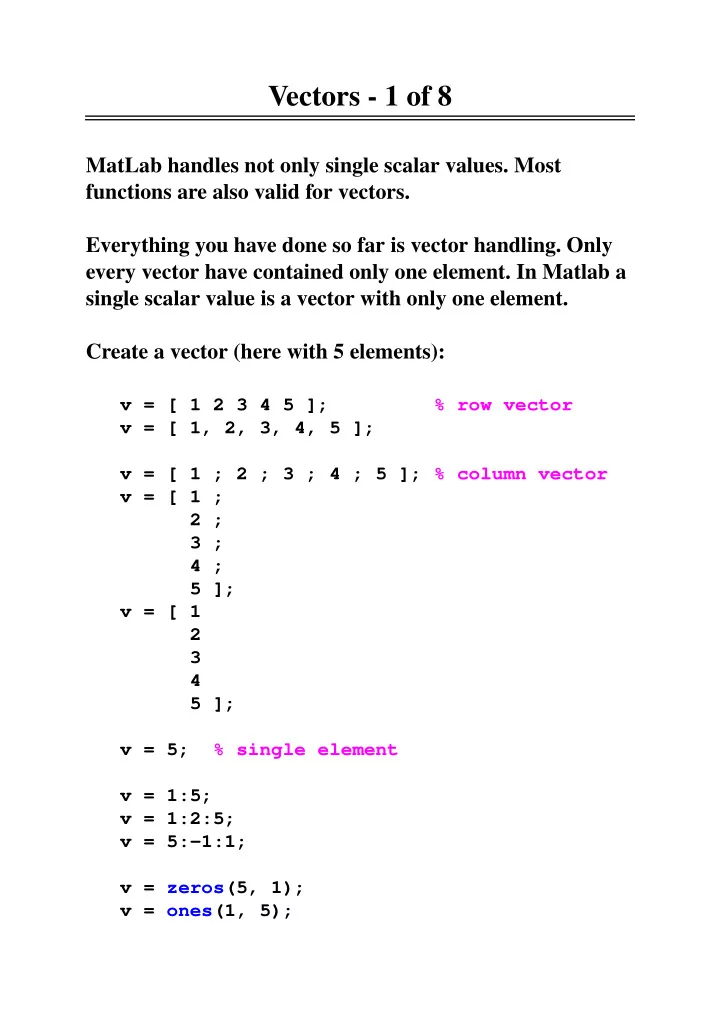

Vectors - 1 of 8 MatLab handles not only single scalar values. Most functions are also valid for vectors. Everything you have done so far is vector handling. Only every vector have contained only one element. In Matlab a single scalar value is a vector with only one element. Create a vector (here with 5 elements): v = [ 1 2 3 4 5 ]; % row vector v = [ 1, 2, 3, 4, 5 ]; v = [ 1 ; 2 ; 3 ; 4 ; 5 ]; % column vector v = [ 1 ; 2 ; 3 ; 4 ; 5 ]; v = [ 1 2 3 4 5 ]; v = 5; % single element v = 1:5; v = 1:2:5; v = 5:-1:1; v = zeros(5, 1); v = ones(1, 5);
Vectors - 2 of 8 Display a vector: disp(v); disp([ 1 2 3 ]); answer = 5; disp([ ’The sum is ’ num2str(answer) ]); Transpose (rotate 90 degrees): v = v’; % v become column vector v = v’; % v become row vector again Find properties of a vector: v = 1:3:9; % [ 1 4 7 ] l = length(v); % 3 s = size(v); % [ 1 3 ] Index a vector: v(1) % The value at index 1 in v v(2:3) % A vector with the values in % indexes 2 to 3 in v v = [ 3 1 2 ]; % Assumed content of v v(v) % [ 2 3 1 ]
Vectors - 3 of 8 For-statement: v = 1:2:20; % The assumed content of v for i = 1:5 disp(i) end for i = v disp(i) end for i = 1:length(v) disp(i) disp(v(i)) end for i = [ 1 3 5 2 4 6 ] disp(v(i)) i = i + 1; % Changes ’i’ temporarily, % but do not affect the % for-iteration! disp(i); end % 1 2 5 4 9 6 3 3 7 5 11 7 % (but one number per line) for i = 1:inf disp(i) end % 1 2 3 ... 1.7977e+308 Inf Inf ... % (realmax) realmax + power(10, 291) => realmax % N.B! Still realmax (rounding error!!!)
Vectors - 4 of 8 Function return values: function v = create_vector(number) v = 1:2:number; end function [ a b ] = factorial_and_power(n) a = factorial(n); b = power(n, n); end function [ x y ] = swap(a, b) x = b; y = a; end % Or optionally just: function [ b a ] = swap(a, b) end Above can be called from a main-program ... function main v = create_vector(4); [ f p ] = factorial_and_power(4); [ a b ] = swap(a, b); end Matlab feature: Built-in function can often handle vectors, even if not expected from math point of view. v = sin(v); % New vector with sinus-values
Vectors - 5 of 8 Operations that work on entire vectors: v1 = [ 1 2 3 ]; % The assumed content of v v2 = v1 * 2; % [ 2 4 6 ] v2 = v1 * v1; % FEL! v2 = v1 * v1’; % 14 v2 = v1 .* 2; % [ 2 4 6 ] v2 = v1 .* v1; % [ 1 4 9 ] v2 = v1’ * v1; % NEXT LECTURE! [ 1 2 3 ; 2 4 6 ; 3 6 9 ] Think of what should work and what should not for the arithmetic operations (+-*/) ... v2 = v1 ./ v1; => [ 1 1 1 ] v2 = v1 / v1; => 1.0000 (why ???) v2 = v1 / 2; => [ 0.5000 1.0000 1.5000 ] N.B! .+ and .- do not exist!!!!
Vectors - 6 of 8 Plot vectors: x = 1:360 % The assumed content of v plot(x) % Straight line through points % 1,1 2,2 ... 360,360 y = sind(x); plot(y) % Sinus-curve with x-coordinates % 1-360 (the vector indices) plot(x, y) % Same as above but more % obvious (specify x-index % for every y-index) plot(x * 2, y) % x-coordinates "doubled" When you plot vectors each dot will be automatically connected with a line. More options to plot can be used now. (the ones concerning lines etc.) % Only draw each point with an x (no line) plot(x, y, ’x’); % x in each point, and dashed line connecting plot(x, y, ’:xr’); % Above with line-width 4 plot(x, y, ’:xr’, ’linewidth’, 4); % Continuos red line with x points, dotted % green line with * points, line-width 4 plot(x, y, ’-xr’, x, y, ’:*g’, ... ’linewidth’, 4);
Vectors - 7 of 8 Assignment: Write a function to draw a square with size "n". In- parameter to the function should be the size. Solution: function square(n) figure; plot(-n, -n, 2*n, 2*n); hold on; plot([0 n n 0 0], [0 0 n n 0]); hold off; end
Vectors - 8 of 8 Question: Why is the solution below not very good? for i = 1:5 hold on; plot( ... ); hold off; end Answer: More efficient to do "hold on" and "hold off" outside the loop, since it should only be done once ... Exception: If you use "clf" also the "hold on" setting will be cleared. Sometimes you must use hold inside the loop ...
Lab hints / requirements In the assignment that draw bars it is not acceptable to use the built-in function "bar". You shall train how to draw the bars with "plot", in order to understand how to draw more than just bars. N.B! You are not supposed to draw rectangles, just wide (thick) lines ...
Recommend
More recommend