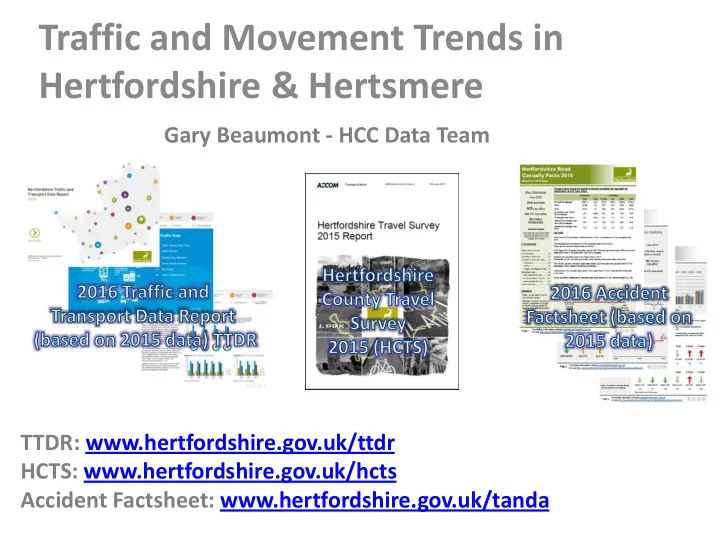

Traffic and Movement Trends in Hertfordshire & Hertsmere Gary Beaumont - HCC Data Team TTDR: www.hertfordshire.gov.uk/ttdr HCTS: www.hertfordshire.gov.uk/hcts Accident Factsheet: www.hertfordshire.gov.uk/tanda
2016 Traffic and Transport Data Report (TTDR) – Based on 2015 data • Annual report • TTDR dates back to the 90’s – traffic data recorded in the 60’s • Summarises all types of traffic data in Herts • Interactive (tabs / hyperlinks) • More simple and visual based – maps / charts • Can develop and update in house • Accompanying summary factsheet produced Hertfordshire County Travel Survey 2015 • Triannual survey (every 3 years) • Dating back to 1999 • Revised in 2015 • Now more focused as a mobility survey (all members of household collected) • However there is 1 open ended question for opinions • Aligns to National Travel Survey
Why do we collect this information? • Open and transparent – lots of work goes into this, lets share it! • Collect it anyway, why not put it in one place? • Key evidence base that feeds strategies (LTP, vision) and reports on indicators • Used for Government bids and monitoring • Go-to place for key information (You tell me what you want in the report) • Provides efficiency (saves duplicating work) Who is it aimed at? • Everyone! • General public / School children / Officers / Councillors / MP’s / Engineers / Lawyers / Parish & Town Councils • Publicity reaches far and wide - Social media (Twitter / Facebook) - Email alert (over 1,000 contacts) - Press - Post (leaflet)
Hertsmere’s sampled profile is almost identical to Hertfordshire’s Categories with similar %’s are… • Has a driving licence • Access to a vehicle • Owns a bus pass • Has health / mobility issue • People per household • Owns a blue badge Exceptions are: • Bicycle ownership • Access to Internet • Average trip distance (6.4miles)
How do the sampled Hertsmere residents travel to work? 60% Work destinations…. 49% 50% 1. London 40% 30% 2. Hertsmere 17% 20% 3. Other / St Albans / 9% 10% 6% 5% 5% Watford / Welwyn Hatfield / 3% 2% 2% 1% 1% 0% 0% 0% 0% Unknown or Other Hertsmere Hertfordshire Mode share…. Tube Other 4% 0% Motorbike Walk 1% Motorbike Passenger Walk Passenger 1. Car driver 5% 7% 1% 4% Tube Cycle Bus 6% 3% 4% Bus 2% 3% 2. Train Train Train 21% 29% 3. Car passenger Driver Driver 50% 59% 4. Walk
transport in Hertfordshire? What do the sampled Hertsmere residents think of 10.00% 12.00% 14.00% 0.00% 2.00% 4.00% 6.00% 8.00% 1.8% Inadequate disabled access/provision for… 4.1% Ticketing/ need for Oyster system PT 2.8% 2.3% Connectivity/interchanging Have been cuts/fear of cuts 3.3% Bus- last service too early/first service too late 4.0% Bus- No/poor Sunday/weekends services 1.0% Bus- poor /inadequate school service 3.1% Bus- too expensive 4.7% Bus- poor quality/reliability 1.8% Bus- frequency too low/competing services… Bus 3.5% Bus- key destinations not served 1.5% Bus- lack of information/real time/ timetables Parking 3% Driving Other 2.5% 2.6% 20% 8% Bus- Lifeline - valued Compliment Bus- No service/no alternative to car 13% ary Cycling 1.7% 6% Bus- Hospital Services Transport 2.5% Awaiting bus pass Public Rail 9% 10% 1.3% Rail -too expensive 2.5% Rail Rail -delays/reliability 31% Bus 5.3% Rail -frequency too low Cycling 6.2% Cycle paths needed/safe cycling routes 8.0% Driving - surfaces poor/need repair 2.2% Driving - junction improvements Driving 9.1% Driving - traffic volume/flow 1.8% Driving - traffic calming - nuisance Parking Other 3.3% Parking - lack of 8.7% Other 13.1% complimentary re services
Recommend
More recommend