
Time Curves: Folding Time to Visualize Patterns of Temporal Evolution in Data Benjamin Bach, Conglei Shi, Nicolas Heulot, Tara Madhyastha Tom Grabowski, Pierre Dragicevic Microsoft Research-Inria Joint Centre, IBM Watson Research Centre IRT SystemX, University of Washington From TVCG 2015 Present by Jianhui (Jimmy) Chen CPSC 547 InfoVis
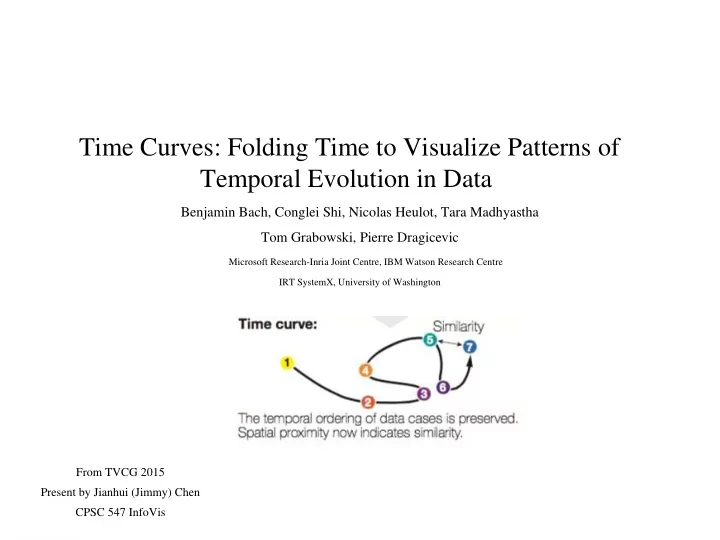
Overview Data: 7 versions of a Wiki article Task: explore document history Pattern: after 4, 5, the article comes back to 3 at 6 Encoding channels: shape, colour 2
Outline What Why How Validation 3
What General temporal data: Videos fMRI Wiki articles Data abstraction: distance matrix 4
Outline What Why How Validation 5
Why Motivation: patterns can be of great interest to domain experts or general audience Task: overview and identify patterns Wiki article on Chocolate Wiki article on InfoVis Long progress at first, edit war in the middle. Cluster, progress, cluster… 6
Outline What Why How Validation 7
How (method) Timeline Time curve Information encoding TL TC Rank distance: how far in time Y Y Curvilinear distance: cumulated changes Y Y+ Spatial distance: effective changes N Y 8
How (implementation) Distance matrices: number of characters inserted or deleted, Euclidean distance,… Time points positions: “classical” MDS method (not clearly defined) [46] Curves: Bézier curve Overlap removal: a simple iterative approach (not clearly defined) Rotating curves : time goes from left to right • A combination of other methods • Sufficient for re-implementation MDS: multipledimensional scaling [46] Multidimensional scaling: I. Theory and method 9
Live demo http://www.aviz.fr/~bbach/timecurves/ 10
Outline What Why How Validation 11
Validation 12
Validation (algorithm) # time points time (sec) 50 9 100 20 500 500 Computational Complexity O(N 3 ) Perceptual scalability: depends on data complexity and and down-sampling method. Stability: shape is kept when adds new time points. 13
Validation (domain situation) Informal user feedback Users : one neuroscientist over two months Task : identify/compare patterns in fMRI data Result: encouraging feedback regarding the usability Pattern: meaningful difference between individuals in (b) fMRI:functional magnetic resonance imaging 14
Time curves: summary Time series: Wikipedia histories, videos What: Data and dynamic network What: Derived Pairwise distances Why: Tasks Reveal patterns in temporal datasets Circles and dots:time stamp How: Encode Curve:evolution Distance and colour: similarity Scale About 100 time points 15
What else? Patterns and examples! 16
Geometric characteristics No effective progress Edit war in Wiki Ineffective reversal Many small changes Chaotic processes Curves between two remote time points 17
Patterns Cluster : minor revision Transition: big progression Cycle : back to previous point after a long progression Outlier : large sudden changes … Specific combination of geometric characteristics 18
Surveillance video video video Derived data Patterns Time stamp: one frame/second Cluster: minor changes Distance : normalized absolute pixel difference Outliers: moving people Video summarization, anomaly detection 19
Cloud coverage and precipitation Patterns: Extremes: Jan & Aug Dec goes to Apr 20
Conclusion • A general approach for visualizing patterns of evolution in temporal data • Demonstrated by lots of examples (solid work) • Gives developing history of time curve method Useful in other domains such software engineering management, law making study…
Critiques • No direct comparison with previous work • Validation is insufficient Video Interpretation from [37] Animated movie example in the paper [37] Image Spaces and Video Trajectories: Using Isomap to Explore Video Sequences 22
Thanks! Q&A 23
24
Recommend
More recommend