The wheat from the chaff: Physical and cultural dimensions of - - PowerPoint PPT Presentation

the wheat from the chaff physical and cultural dimensions
SMART_READER_LITE
LIVE PREVIEW

The wheat from the chaff: Physical and cultural dimensions of - - PowerPoint PPT Presentation

Introduction Ontology Framework Data & Results Conclusions The wheat from the chaff: Physical and cultural dimensions of landscapes and their impact on urbanization Julie Bourbeillon 1 , Damien Rousselire 2 & Julien Salani 3 1


slide-1
SLIDE 1

Introduction Ontology Framework Data & Results Conclusions

The wheat from the chaff: Physical and cultural dimensions of landscapes and their impact on urbanization

Julie Bourbeillon1, Damien Rousselière2 & Julien Salanié3

1Institut de Recherche en Horticulture et Semences, Angers, France 2GRANEM, Agrocampus-Ouest, Angers, France 3GATE Lyon-Saint-Étienne, Saint-Étienne, France

JRSS - Grenoble December 12, 2014

Julien Salanié GATE Lyon-Saint-Étienne December 12, 2014 1 / 36

slide-2
SLIDE 2

Introduction Ontology Framework Data & Results Conclusions

Outline

1

Introduction

Julien Salanié GATE Lyon-Saint-Étienne December 12, 2014 2 / 36

slide-3
SLIDE 3

Introduction Ontology Framework Data & Results Conclusions

Outline

1

Introduction

2

An ontology of landscapes

Julien Salanié GATE Lyon-Saint-Étienne December 12, 2014 2 / 36

slide-4
SLIDE 4

Introduction Ontology Framework Data & Results Conclusions

Outline

1

Introduction

2

An ontology of landscapes

3

Theoretical and empirical framework

Julien Salanié GATE Lyon-Saint-Étienne December 12, 2014 2 / 36

slide-5
SLIDE 5

Introduction Ontology Framework Data & Results Conclusions

Outline

1

Introduction

2

An ontology of landscapes

3

Theoretical and empirical framework

4

Data & Results

Julien Salanié GATE Lyon-Saint-Étienne December 12, 2014 2 / 36

slide-6
SLIDE 6

Introduction Ontology Framework Data & Results Conclusions

Outline

1

Introduction

2

An ontology of landscapes

3

Theoretical and empirical framework

4

Data & Results

5

Conclusions

Julien Salanié GATE Lyon-Saint-Étienne December 12, 2014 2 / 36

slide-7
SLIDE 7

Introduction Ontology Framework Data & Results Conclusions

Introduction

Urbanization is a main fact of the last century:

  • in the U.S.: 40% urban in 1960 ⇒ 60% in 1990
  • worldwide: 29% urban in 1950 ⇒ 50% in 2008
  • 75% of the European population is urban

Consequence: important agricultural land uptake

Julien Salanié GATE Lyon-Saint-Étienne December 12, 2014 3 / 36

slide-8
SLIDE 8

Introduction Ontology Framework Data & Results Conclusions

Introduction

Urbanization is a main fact of the last century:

  • in the U.S.: 40% urban in 1960 ⇒ 60% in 1990
  • worldwide: 29% urban in 1950 ⇒ 50% in 2008
  • 75% of the European population is urban

Consequence: important agricultural land uptake ⇒ 640 000 ha of agricultural land urbanized between 2000 and 2006 in Europe

  • 46% on cropland
  • 32% on grasslands
  • 13% on forest lands
  • 9% on natural and fallow lands

Julien Salanié GATE Lyon-Saint-Étienne December 12, 2014 3 / 36

slide-9
SLIDE 9

Introduction Ontology Framework Data & Results Conclusions

Introduction

The drivers of urbanization and urban sprawl have been well documented:

  • drop in transportation costs (private car) (Glaeser and Kahn, HRUE,

2004)

  • raising income
  • "flight from blight"
  • "mis-specified" urban policies (minimum lot size, land controls, etc.)
  • amenities and periurban lifestyle (Cavailhès et al., RSUE, 2003)

Julien Salanié GATE Lyon-Saint-Étienne December 12, 2014 4 / 36

slide-10
SLIDE 10

Introduction Ontology Framework Data & Results Conclusions

Introduction

The drivers of urbanization and urban sprawl have been well documented:

  • drop in transportation costs (private car) (Glaeser and Kahn, HRUE,

2004)

  • raising income
  • "flight from blight"
  • "mis-specified" urban policies (minimum lot size, land controls, etc.)
  • amenities and periurban lifestyle (Cavailhès et al., RSUE, 2003)

One important stream of the literature: Land-use change at the urban fringe Land use change determinants:

  • land rent in several uses (urban, agriculture, etc.)
  • conversion costs

Julien Salanié GATE Lyon-Saint-Étienne December 12, 2014 4 / 36

slide-11
SLIDE 11

Introduction Ontology Framework Data & Results Conclusions

Introduction

Periurban quality of life and amenities:

  • play an important role in housing prices (Boyle & Kiel, JREL, 2001

for a review)

Urbanization reduces amenities:

  • public services crowding (Cavailhès et al., 2009, ERE)
  • views deterioration (Cavailhès et al., 2009)
  • people prefer low densities: negative externalities among residents

(Roe et al., Land Econ., 2004 ; Irwin & Bockstael, RSUE, 2004)

landscape indicators: share of farmland, density, number of trees, . . .

Julien Salanié GATE Lyon-Saint-Étienne December 12, 2014 5 / 36

slide-12
SLIDE 12

Introduction Ontology Framework Data & Results Conclusions

Introduction

Economists’ view similar to that of physical geographers (objects) ⇒ quantify: objective metrics

Julien Salanié GATE Lyon-Saint-Étienne December 12, 2014 6 / 36

slide-13
SLIDE 13

Introduction Ontology Framework Data & Results Conclusions

Introduction

Economists’ view similar to that of physical geographers (objects) ⇒ quantify: objective metrics For human geographers, the landscape is more than that.

  • cultural landscape: social phenomena
  • weight of individual and social interactions
  • history, arts, literature, customs, institutions, . . .

⇒ culture shape people’s perceptions (and behavior)

Julien Salanié GATE Lyon-Saint-Étienne December 12, 2014 6 / 36

slide-14
SLIDE 14

Introduction Ontology Framework Data & Results Conclusions

Introduction

a mountain

Julien Salanié GATE Lyon-Saint-Étienne December 12, 2014 7 / 36

slide-15
SLIDE 15

Introduction Ontology Framework Data & Results Conclusions

Introduction

a mountain "La montagne Sainte-Victoire vue de Bellevue" Paul Cézanne (1885)

Julien Salanié GATE Lyon-Saint-Étienne December 12, 2014 7 / 36

slide-16
SLIDE 16

Introduction Ontology Framework Data & Results Conclusions

Introduction

a tree

Julien Salanié GATE Lyon-Saint-Étienne December 12, 2014 8 / 36

slide-17
SLIDE 17

Introduction Ontology Framework Data & Results Conclusions

Introduction

a tree "Montagnes de l’Esterel" Claude Monet (1888)

Julien Salanié GATE Lyon-Saint-Étienne December 12, 2014 8 / 36

slide-18
SLIDE 18

Introduction Ontology Framework Data & Results Conclusions

Introduction

For human (cultural) geographers & for the European Landscape Convention: perceptions and culture are crucial Definition: Landscape (Council of Europe, Florence, 2000) "Landscape" means an area, as perceived by people, whose character is the result of the action and interaction of natural and/or human factors

Julien Salanié GATE Lyon-Saint-Étienne December 12, 2014 9 / 36

slide-19
SLIDE 19

Introduction Ontology Framework Data & Results Conclusions

Introduction

Our contribution:

  • 1. introduction of landscape perception in land-use change

model

  • 2. construction of an ontology of landscape
  • interdisciplinary work involving:
  • landscapers, cultural geographers
  • computer scientists
  • GIS scientists
  • economists

Julien Salanié GATE Lyon-Saint-Étienne December 12, 2014 10 / 36

slide-20
SLIDE 20

Introduction Ontology Framework Data & Results Conclusions

Introduction

Economic literature is sparse on the role played by culture and perception:

  • behavioral finance: sentiments, moods, . . . (textmining,

twitter, . . . )

  • growth & development: trust in institutions, religion, . . .
  • economic outcomes: identity, social ties (social norms, . . . )

We also document another important topic where culture and perceptions may play an important role.

Julien Salanié GATE Lyon-Saint-Étienne December 12, 2014 11 / 36

slide-21
SLIDE 21

Introduction Ontology Framework Data & Results Conclusions

What is an ontology?

In computer science, an ontology is a tool to represent the knowledge we have on a real (or abstract) object. Definition: Ontology (Computer Science – Gruber, 1992) An ontology is a formal specification of a shared conceptualization Over a domain, an ontology relates classes (of concepts) to their attributes and relations between concepts.

Julien Salanié GATE Lyon-Saint-Étienne December 12, 2014 12 / 36

slide-22
SLIDE 22

Introduction Ontology Framework Data & Results Conclusions

What is an ontology?

In computer science, an ontology is a tool to represent the knowledge we have on a real (or abstract) object. Definition: Ontology (Computer Science – Gruber, 1992) An ontology is a formal specification of a shared conceptualization Over a domain, an ontology relates classes (of concepts) to their attributes and relations between concepts. In practice it’s a database relating terms to classes of concepts functionnaly related.

  • lexical domain: vocabulary related to a concept (holidays: sun, beach,

sea, farniente, . . . )

  • (contextual) semantic domain: different meanings of words ("alone in the

dark" vs. "the dark side of the force")

Julien Salanié GATE Lyon-Saint-Étienne December 12, 2014 12 / 36

slide-23
SLIDE 23

Introduction Ontology Framework Data & Results Conclusions

A (geographical) ontology for landscapes

Several steps:

1 build a skeleton (architecture of relation between concepts) 2 identify words to describe the classes 3 attached them to an area (spatial) 4 iterate

In our case: areas and the vocabulary comes from Landscape Atlases Additional potential sources: land use ordinances, land use conflicts resolutions at the court, surveys, . . .

Julien Salanié GATE Lyon-Saint-Étienne December 12, 2014 13 / 36

slide-24
SLIDE 24

Introduction Ontology Framework Data & Results Conclusions

An ontology for landscapes

Julien Salanié GATE Lyon-Saint-Étienne December 12, 2014 14 / 36

slide-25
SLIDE 25

Introduction Ontology Framework Data & Results Conclusions

An ontology for landscapes

Julien Salanié GATE Lyon-Saint-Étienne December 12, 2014 15 / 36

slide-26
SLIDE 26

Introduction Ontology Framework Data & Results Conclusions

An ontology for landscapes

applies on by senses

Julien Salanié GATE Lyon-Saint-Étienne December 12, 2014 16 / 36

slide-27
SLIDE 27

Introduction Ontology Framework Data & Results Conclusions

An ontology for landscapes

Landscape composition

Julien Salanié GATE Lyon-Saint-Étienne December 12, 2014 17 / 36

slide-28
SLIDE 28

Introduction Ontology Framework Data & Results Conclusions

An ontology for landscapes

Perception components spatial positive/negative Landscape traits

Julien Salanié GATE Lyon-Saint-Étienne December 12, 2014 18 / 36

slide-29
SLIDE 29

Introduction Ontology Framework Data & Results Conclusions

An ontology for landscapes

Julien Salanié GATE Lyon-Saint-Étienne December 12, 2014 19 / 36

slide-30
SLIDE 30

Introduction Ontology Framework Data & Results Conclusions

Plan - you are here

1

Introduction

2

An ontology of landscapes

3

Theoretical and empirical framework Land-use change model Internal meta-analysis

4

Data & Results

5

Conclusions

Julien Salanié GATE Lyon-Saint-Étienne December 12, 2014 20 / 36

slide-31
SLIDE 31

Introduction Ontology Framework Data & Results Conclusions

Theoretical framework

A two step approach:

1 Explain land-use change (discrete choice model)

  • alternative land rent determinants
  • objective landsape measures (land share, landscape metrics)
  • landsape perception measures ⇒ landscape units dummies

2 Explain differences in land use conversion probability among

landscape units:

  • account for different modelling options
  • internal meta-analysis

Julien Salanié GATE Lyon-Saint-Étienne December 12, 2014 21 / 36

slide-32
SLIDE 32

Introduction Ontology Framework Data & Results Conclusions

Theoretical framework (1st step)

A landowner chooses the optimal time t∗ to convert parcel i to urban use:

max

t∗ NPVit ≡

t∗

t

Ra(xai, τ)e−rτdτ + +∞

t∗

Ru(xui, τ)e−r(τ−t)dτ − C(yi, t∗)e−r(t∗−t) ∀t ∈ [0, t∗] (1) Ra(xai, τ) = land rent in agricultural use Ru(xui, τ) = land rent in urban use C(yi, t∗) = conversion costs xai, xui and yi: parcel’s characteristics

Julien Salanié GATE Lyon-Saint-Étienne December 12, 2014 22 / 36

slide-33
SLIDE 33

Introduction Ontology Framework Data & Results Conclusions

Theoretical framework (1st step)

A landowner chooses the optimal time t∗ to convert parcel i to urban use:

max

t∗ NPVit ≡

t∗

t

Ra(xai, τ)e−rτdτ + +∞

t∗

Ru(xui, τ)e−r(τ−t)dτ − C(yi, t∗)e−r(t∗−t) ∀t ∈ [0, t∗] (1) Ra(xai, τ) = land rent in agricultural use Ru(xui, τ) = land rent in urban use C(yi, t∗) = conversion costs xai, xui and yi: parcel’s characteristics

The optimal rule: Ru(xui, t∗) = Ra(xai, t∗) + rC(yi, t∗) (2)

Julien Salanié GATE Lyon-Saint-Étienne December 12, 2014 22 / 36

slide-34
SLIDE 34

Introduction Ontology Framework Data & Results Conclusions

Theoretical framework (1st step)

Deterministic rule (K potential land uses):

arg max

k

(Rk(xki, t) − rCjk(yi, t)) ≥ Rj(xji, t) with j, k ∈ {1, . . . , K}

Stochastic rule:

arg max

k

¯ Rk(xki, t) + εjkit

  • ≥ ¯

Rj(xji, t) + εjjit with j, k ∈ {1, . . . , K}

with ¯ Rk the deterministic (observed) part of land rent

Julien Salanié GATE Lyon-Saint-Étienne December 12, 2014 23 / 36

slide-35
SLIDE 35

Introduction Ontology Framework Data & Results Conclusions

Theoretical framework (1st step)

The probability of conversion at time t: Probi (k|j, t) = Probi

  • εjkit − εjjit > ¯

Rj(xji, t) − ¯ Rk(xki, t)

  • (3)

Using an generalized extreme type I error distribution yields the logit model: Probi (k|j, t) = eβ′

kxki

K

  • ℓ=1

eβ′

ℓxℓi

(4)

Julien Salanié GATE Lyon-Saint-Étienne December 12, 2014 24 / 36

slide-36
SLIDE 36

Introduction Ontology Framework Data & Results Conclusions

Plan - you are here

1

Introduction

2

An ontology of landscapes

3

Theoretical and empirical framework Land-use change model Internal meta-analysis

4

Data & Results

5

Conclusions

Julien Salanié GATE Lyon-Saint-Étienne December 12, 2014 25 / 36

slide-37
SLIDE 37

Introduction Ontology Framework Data & Results Conclusions

Theoretical framework (2nd step)

Marginal effect on conversion probability of being in a landscape unit m (LUm):

  • Pm

kui =∂Probi(k = urban|j = urban, t)

∂LUm

i

=Probi(k|j, t, LUm

i = 0) − Probi(k|j, t, LUm i = 1)

(5)

For each landscape unit (m = 13):        empirical mean: µm

P =

1 Nm

Nm

  • i=1
  • Pm

kui

empirical variance: (σm

P )2 =

1 Nm − 1

Nm

  • i=1

( Pm

kui − µm P )2

(6)

Julien Salanié GATE Lyon-Saint-Étienne December 12, 2014 26 / 36

slide-38
SLIDE 38

Introduction Ontology Framework Data & Results Conclusions

Theoretical framework (2nd step)

13 measures of µm

P and (σm P )2 and 16 model specifications

13 × 16 = 208 observations Internal meta-analysis: (random effects model)

µm

Pr = θRRr + θDDr + ur + ǫr

with

  • ur ∼ N(0, τ 2)

ǫr ∼ N(0, (σm

Pr)2)

(7)

with r: index fo model r Rr a vector of Landscape Units characteristics Dr a vector of covariates describing model r ur error term specific to each model r ǫr classical error term θR, θD, τ 2 parameters to estimated using REML

µm

Pr ∼ N(θRRr + θDDr, τ 2 + (σm Pr)2))

(8)

Julien Salanié GATE Lyon-Saint-Étienne December 12, 2014 27 / 36

slide-39
SLIDE 39

Introduction Ontology Framework Data & Results Conclusions

Data

Julien Salanié GATE Lyon-Saint-Étienne December 12, 2014 28 / 36

slide-40
SLIDE 40

Introduction Ontology Framework Data & Results Conclusions

Plan - you are here

1

Introduction

2

An ontology of landscapes

3

Theoretical and empirical framework

4

Data & Results Data Estimation results

5

Conclusions

Julien Salanié GATE Lyon-Saint-Étienne December 12, 2014 29 / 36

slide-41
SLIDE 41

Introduction Ontology Framework Data & Results Conclusions

Data

221 087 observations (pixels) in Angers metropolitan statistical area (2000-2010)

Julien Salanié GATE Lyon-Saint-Étienne December 12, 2014 30 / 36

slide-42
SLIDE 42

Introduction Ontology Framework Data & Results Conclusions

Data

Ru(xui, τ):

  • distances to CBD, SBD and intercity road network
  • public services at SBD, population income, national park
  • share of urbanized pixels in the neighborhood (500m threshold)
  • landscape: landscape metrics

Julien Salanié GATE Lyon-Saint-Étienne December 12, 2014 31 / 36

slide-43
SLIDE 43

Introduction Ontology Framework Data & Results Conclusions

Data

Ru(xui, τ):

  • distances to CBD, SBD and intercity road network
  • public services at SBD, population income, national park
  • share of urbanized pixels in the neighborhood (500m threshold)
  • landscape: landscape metrics

Ra(xai, τ):

  • slopes, technical orientation of the area (OTEX), small

agricultural regions (PRA)

Julien Salanié GATE Lyon-Saint-Étienne December 12, 2014 31 / 36

slide-44
SLIDE 44

Introduction Ontology Framework Data & Results Conclusions

Data

Ru(xui, τ):

  • distances to CBD, SBD and intercity road network
  • public services at SBD, population income, national park
  • share of urbanized pixels in the neighborhood (500m threshold)
  • landscape: landscape metrics

Ra(xai, τ):

  • slopes, technical orientation of the area (OTEX), small

agricultural regions (PRA) C(yi, t∗):

  • agriculture or forest in 2000

Julien Salanié GATE Lyon-Saint-Étienne December 12, 2014 31 / 36

slide-45
SLIDE 45

Introduction Ontology Framework Data & Results Conclusions

Plan - you are here

1

Introduction

2

An ontology of landscapes

3

Theoretical and empirical framework

4

Data & Results Data Estimation results

5

Conclusions

Julien Salanié GATE Lyon-Saint-Étienne December 12, 2014 32 / 36

slide-46
SLIDE 46

Introduction Ontology Framework Data & Results Conclusions

Results (1st step)

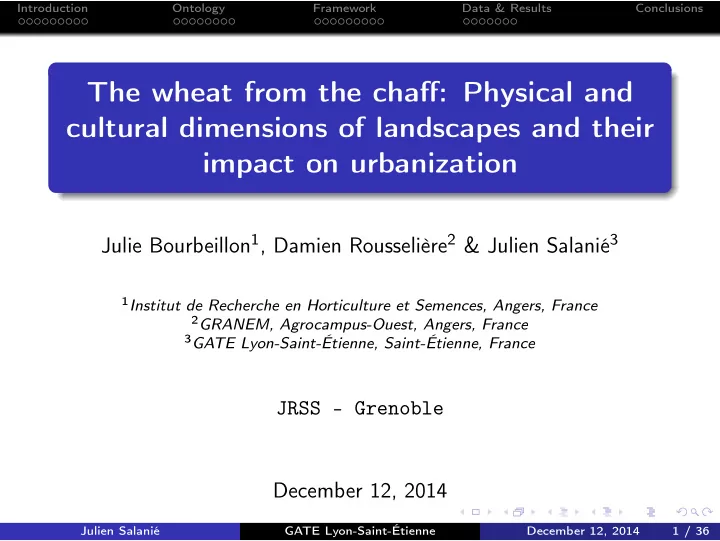
Covariate model (1) model (6) model (16) forest urban forest urban forest urban Intercept

  • 1.91∗∗∗

4.41∗∗∗

  • 1.00∗

3.28∗∗∗

  • 16.26∗∗∗

5.48∗∗∗

  • Dist. CBD
  • 0.17∗∗∗

0.02

  • 0.21∗∗∗

0.18∗∗∗

  • 0.10∗∗∗

0.16∗∗∗ (Dist. CBD)2 0.00∗∗∗

  • 0.00

0.00∗∗∗

  • 0.00∗∗∗

0.00

  • 0.00∗∗∗
  • Dist. SBD

0.39∗∗∗

  • 1.42∗∗∗

0.37∗∗∗

  • 1.60∗∗∗

0.50∗∗∗

  • 1.63∗∗∗

(Dist. SBD)2

  • 0.06∗∗∗

0.23∗∗∗

  • 0.05∗∗∗

0.26∗∗∗

  • 0.08∗∗∗

0.26∗∗∗ Income

  • 0.07∗∗∗

0.05∗∗

  • 0.10∗∗∗

0.10∗∗∗

  • 0.05∗∗

0.10∗∗∗ Income × Dist. CBD 0.01∗∗∗

  • 0.00

0.01∗∗∗

  • 0.00∗∗

0.00∗∗∗

  • 0.00∗∗∗
  • Dist. road

0.13∗∗∗

  • 0.18∗∗∗

0.15∗∗∗

  • 0.13∗∗∗

0.27∗∗∗

  • 0.10∗∗∗

(Dist. road)2

  • 0.01∗∗∗

0.02∗∗∗

  • 0.02∗∗∗

0.01∗∗∗

  • 0.03∗∗∗

0.01∗∗∗ Slope 0.05∗∗∗ 0.04∗∗∗ 0.06∗∗∗ 0.06∗∗∗ 0.06∗∗∗ 0.06∗∗∗ (Slope)2 0.00

  • 0.00∗∗∗

0.00

  • 0.00∗∗∗

0.00

  • 0.00∗∗∗

Park

  • 0.11∗∗

0.31∗∗∗ 0.21∗∗ 0.53∗∗∗ 0.19 0.34∗∗ Public services 0.00∗

  • 0.00∗∗∗

0.00∗∗∗ 0.01∗∗∗ 0.00∗∗∗ 0.00∗∗∗ Public services × Dist. SBD

  • 0.00∗∗∗

0.00∗∗∗

  • 0.00∗∗∗

0.00∗∗∗

  • 0.00∗∗∗

0.00∗∗∗ Urbanized neigh. in 2000

  • 2.57∗∗∗

10.54∗∗∗

  • 2.33∗∗∗

10.44∗∗∗

  • 2.30∗∗∗

10.28∗∗∗ (Urbanized neigh. in 2000)2 4.51∗∗∗

  • 6.74∗∗∗

4.03∗∗∗

  • 6.86∗∗∗

3.50∗∗∗

  • 6.80∗∗∗

Farmland in 2000

  • 0.54
  • 7.60∗∗∗
  • 0.51
  • 7.73∗∗∗
  • 0.48
  • 7.77∗∗∗

Forest en 2000 4.35∗∗∗

  • 6.49∗∗∗

4.34∗∗∗

  • 6.65∗∗∗

4.23∗∗∗

  • 6.79∗∗∗

Floodable 0.38∗∗∗

  • 1.76∗∗∗

0.59∗∗∗

  • 1.72∗∗∗

0.54∗∗∗

  • 1.70∗∗∗

LU yes yes yes PRA no no yes Counties no yes yes OTEX no yes yes Landscape metrics no no yes Observations 221 087 221 087 221 087 logL

  • 52 842
  • 52 113
  • 51 477

pseudo-R2 0.647 0.652 0.656 AIC 106 136 105 297 103 227

∗∗∗. ∗∗ et ∗ identify parameters significant at 0.01%, 0.05% et 0.1% respectively.

Julien Salanié GATE Lyon-Saint-Étienne December 12, 2014 33 / 36

slide-47
SLIDE 47

Introduction Ontology Framework Data & Results Conclusions

Results (1st step): Estimated marginal effects ( Pm

kui)

Landscape Units Marginal Effect Minimum Maximum µm

P

(σm

P )2

µm

P

(σm

P )2

µm

P

(σm

P )2

L’Agglomération angevine 0.0349 0.0035 0.0258 0.0024 0.0418 0.0043 La Loire des promontoires 0.0313 0.0025 0.0239 0.0015 0.0399 0.0036 Le Beaugeois 0.0191 0.0012 0.0146 0.0009 0.0256 0.0015 Le Couloir du Layon 0.0242 0.0027 0.0173 0.0011 0.0340 0.0048 Le Haut Anjou 0.0255 0.0015 0.0217 0.0009 0.0314 0.0019 Le Saumurois 0.0115 0.0012 0.0075 0.0008 0.0147 0.0018 Le Segréen 0.0256 0.0019 0.0172 0.0008 0.0287 0.0025 Le Val d’Anjou 0.0150 0.0011 0.0128 0.0009 0.0198 0.0013 Les Basses valléees angevines 0.0167 0.0016 0.0116 0.0012 0.0226 0.0018 Les Marches du Segréen 0.0225 0.0019 0.0149 0.0009 0.0270 0.0026 Les Mauges 0.0145 0.0033 0.0100 0.0024 0.0208 0.0050 Les Plateaux de l’Aubance 0.0257 0.0025 0.0185 0.0011 0.0373 0.0044 Les Portes du Beaugeois 0.0217 0.0016 0.0162 0.0013 0.0279 0.0022 Total 0.0222 0.0020 0.0075 0.0008 0.0418 0.0050

Julien Salanié GATE Lyon-Saint-Étienne December 12, 2014 34 / 36

slide-48
SLIDE 48

Introduction Ontology Framework Data & Results Conclusions

Results (2nd step)

Tropes scenarios (another ontology) base controles AIC complete

  • Agri. / Envt.

0.3302∗∗∗ 0.3300∗∗∗ 0.3303∗∗∗ 0.3301∗∗∗ Anim./ Veget. 0.0414∗∗ 0.0389∗ 0.0409∗∗ 0.0389∗ Arts / Culture

  • 0.0752
  • 0.0806
  • 0.0763
  • 0.0806

Traits 0.2815∗∗∗ 0.2812∗∗∗ 0.2816∗∗∗ 0.2813∗∗∗

  • Comm. / Medias

0.5594∗∗∗ 0.5618∗∗∗ 0.5611∗∗∗ 0.5619∗∗∗

  • Comport. / Sent.

0.3843∗∗∗ 0.3849∗∗∗ 0.3845∗∗∗ 0.3850∗∗∗ Forces / quantities

  • 0.2905∗∗∗
  • 0.2972∗∗∗
  • 0.2921∗∗∗
  • 0.2974∗∗∗

Geography 0.1500∗∗∗ 0.1485∗∗∗ 0.1500∗∗∗ 0.1485∗∗∗ Politics / Society 0.7213∗∗∗ 0.7214∗∗∗ 0.7216∗∗∗ 0.7216∗∗∗ Transports

  • 0.0384
  • 0.0421
  • 0.0389
  • 0.0421

OTEX 0.0006 0.0005 PRA 0.0012∗∗ 0.0007 Counties 0.0006

  • 0.0011

Metrics

  • 0.0001
  • 0.0020

AIC

  • 0.0000
  • 0.0000

Intercept

  • 0.1598∗∗∗
  • 0.1600∗∗∗
  • 0.1162∗

0.0085 Observations 208 208 208 208 τ2 1.31e-05 1.34e-05 1.32e-05 1.35e-05 I 2 0.835 0.838 0.836 0.839 adjusted-R2 0.734 0.728 0.732 0.727 χ2

c

667.0 678.0 669.6 679.3 LRT test(τ2 = 0) 4.93e-05 4.93e-05 4.93e-05 4.93e-05 F test 40.82 30.00 37.32 27.92

∗∗∗. ∗∗ and ∗ identify parameters significant at 0.01%, 0.05% et 0.1% respectively.

Julien Salanié GATE Lyon-Saint-Étienne December 12, 2014 35 / 36

slide-49
SLIDE 49

Introduction Ontology Framework Data & Results Conclusions

Conclusions

Contribution:

  • A land-use change model linked to a geographical ontology
  • Landscape perception and culture may play a role in explaining

urbanization

  • Not a major one however
  • Agnew/King controversy on the role of context in human

geography Main limits (to be overcome):

  • Make use of our ontology (rather than Tropes)
  • spatial (spatial probit, GAM, spatial sampling)
  • zoning ?

Julien Salanié GATE Lyon-Saint-Étienne December 12, 2014 36 / 36