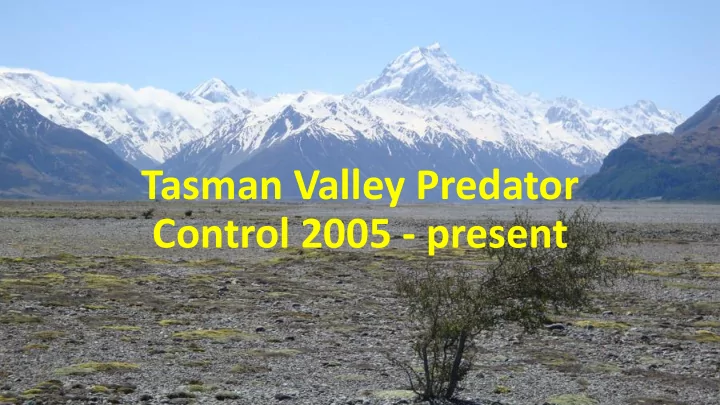

Tasman Valley Predator Control 2005 - present
Kill traps
Leghold traps
Cat captures 40 35 30 25 20 15 10 5 0 Mar Apr May Jun Jul Aug Sep Oct Nov Dec Jan Feb Year 2005-06 Average 06/07 to 15/16 Year 2016-17
2016/17 Cat captures 1-3 scale
Stoat captures 180 160 140 120 100 80 60 40 20 0 Mar Apr May Jun Jul Aug Sep Oct Nov Dec Jan Feb Year 2005-06 Average 06/07 to 15/16 Year 2016-17
2016/17 stoat captures 1-5 scale
Hedgehog captures 180 160 140 120 100 80 60 40 20 0 Mar Apr May Jun Jul Aug Sep Oct Nov Dec Jan Feb Year 2005-06 Average 06/07 to 15/16 Year 2016-17
2016/17 hedgehog captures 1-5 scale
Ferret captures 60 50 40 30 20 10 0 Mar Apr May Jun Jul Aug Sep Oct Nov Dec Jan Feb Year 2005-06 Average 06/07 to 15/16 Year 2016-17
2016/17 ferret captures 1-3 scale
Monthly totals 2016/17 and totals since 2005 Total since Total March Including 05 legholds TARGET SPECIESMar-16² Apr-16² May-16 Jun-16 Jul-16 Aug-16 Sep-16 Oct-16 Nov-16 Dec-16 Jan-17² Feb-17² Total 2463 Cat 12 38 34 18 15 7 2 0 0 1 21 3 151 1693 829 Ferret 8 4 5 5 3 0 0 0 0 0 4 4 33 817 8782 Hedgehog 43 72 23 18 13 0 14 64 44 39 144 65 539 7445 45 Norway rat 2 2 0 2 1 0 0 0 0 0 0 0 7 44 653 Possum 0 0 0 0 2 0 3 2 5 1 0 0 13 484 4048 Stoat 21 35 24 29 22 20 5 0 6 26 156 36 380 3825 216 Weasel 0 3 1 0 0 0 1 3 0 2 21 1 32 209 17036 Total 86 154 87 72 56 27 25 69 56 69 346 109 1156 14549
Analysis and changes • After five years of control - Species specific responses by ground-nesting Charadriiformes to invasive predators and river flows in the Braided Tasman River of NZ. Jennyffer Cruz et al. • Results were fairly ambivalent but highlighted the complexities of evaluating the benefits of predator management on multiple prey species in the same ecosystem. • In 2013 following trail camera use on BFT nests, black-backed gull control was started. • In 2015, leg-hold trapping was changed to a valley-wide regime for two 10 day sessions in May and August • In 2016, this was changed to one valley-wide 10 day session in April-May
Black-backed gull control Year Technique Field Hours – staff/ Approx cost # of adults, chicks contractors and eggs 2013 Alphachloralose 486 (staff) $15,100 352 adults 49 chicks 2014 Ground shooting around nesting 65 (contractor) $3600 636 adults areas 50 chicks 112 eggs 2015 Ground shooting mainly over 75 (staff and contractor) $3100 147 adults bait dumps 23 chicks 20 eggs 2016 Ground shooting mainly over 60 $2500 152 adults bait dumps 7 chicks 2016 Aerial shooting from Cabri G2 41 $5875 250 adults Helicopter (4.5 hrs @ $750/hour)
Index counts of BFTs on the Tasman River. Predator control began in 2005
Wrybill nesting success
Back-fronted tern nesting success
Numbers of kaki pairs nesting in each of the main river catchments
Kaki Recruitment rates • In the Tasman over the last few years, recruitment to breeding age has risen to 49% from 22% previously • Overall kaki recruitment is 29%
The future • Continued BBG control including other big colonies in other catchments • Extending predator control into other main catchments to the north east • Maintain good outcome monitoring on key species
Acknowledgements • Richard Maloney and Mark Sanders for the proposal. • Trappers over the years including Eigill Wahlberg, Simon Stevenson, Tom Barr, Shaun Aitcheson, Glen Currall, Carol Burke and Glenn MacDonald. • Aoraki Mt Cook volunteer trappers. • Heaps of staff involved with outcome monitoring but in particular Antje Leseberg, Simone Cleland and Phil Guilford. • Glentanner and Mt Cook Station owners for ongoing access.
Recommend
More recommend